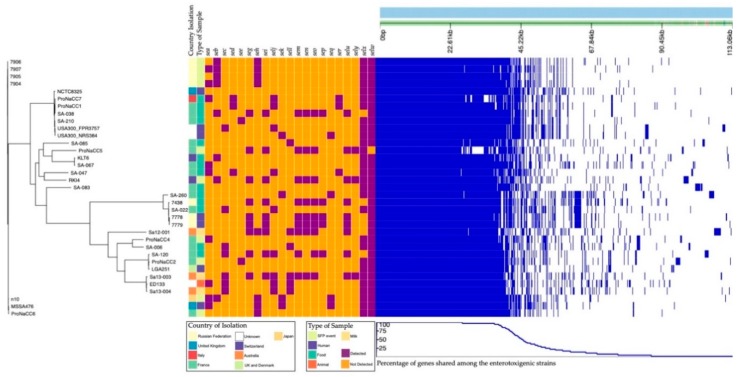
Figure 10.
Pan-genomic analysis of the 35 enterotoxigenic strains. On the left side is the phylogenetic tree of the strains included in this study. On the central heatmap is the the geographical location of isolation and sources (colour legend in the picture). The detection of the gene coding for enterotoxins is reported as presence and absence with the colours purple and orange respectively.

