Figure 6.
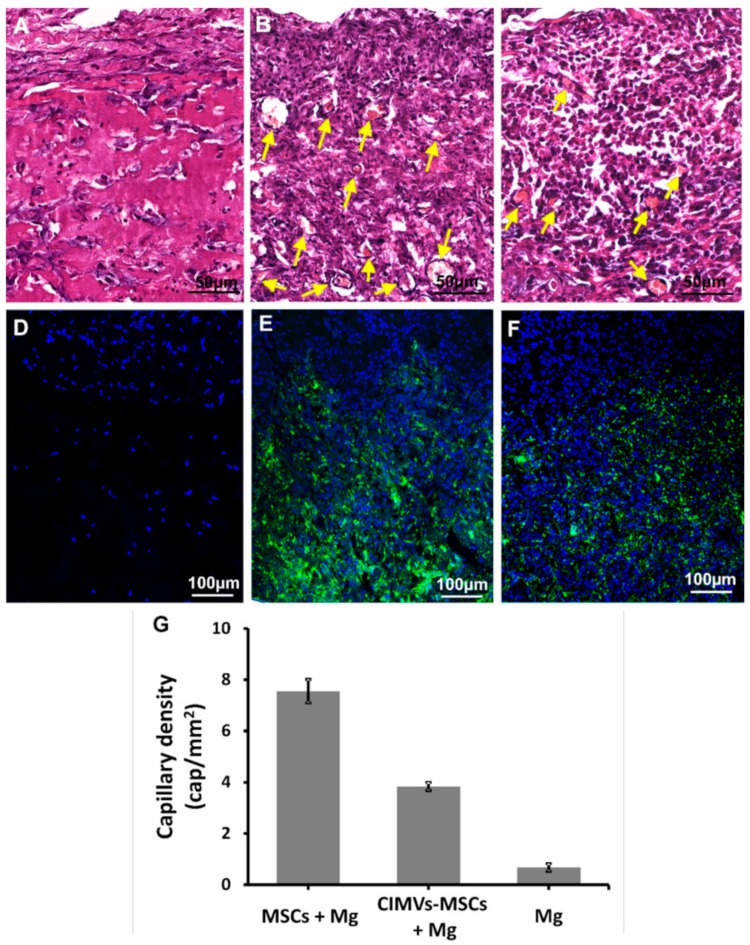
Analysis of angiogenic activity of MSCs and CIMVs-MSCs in vivo. Hematoxylin/eosin staining (A–C) and fluorescence micrographs (D–F) are shown after subcutaneous injections in rats (6 animals per experimental group) of MSCs (106 cells) or CIMVs-MSCs (50 µg). (A and D) Negative control (subcutaneous injection of Matrigel matrix); (B and E) subcutaneously injection of MSCs; (C and F) subcutaneous injection of CIMVs-MSCs. MSCs and CIMVs-MSCs were stained with DiO (membrane dye) before the subcutaneous injection. Green fluorescence—DiO stained MSCs and CIMVs-MSCs; blue fluorescence—DAPI (stains DNA). Arrows mark the position of the sprouting blood capillaries. Counting of the total number of vessels was carried out using the AxioVision 4.8 program (CarlZeiss, Oberkochen, Germany). (G) Quantitation of the capillary density in Matrigel matrix plugs. The data represents mean ± SD. For statistical analysis, ten hematoxylin and eosin stained slides per animal were analyzed.

