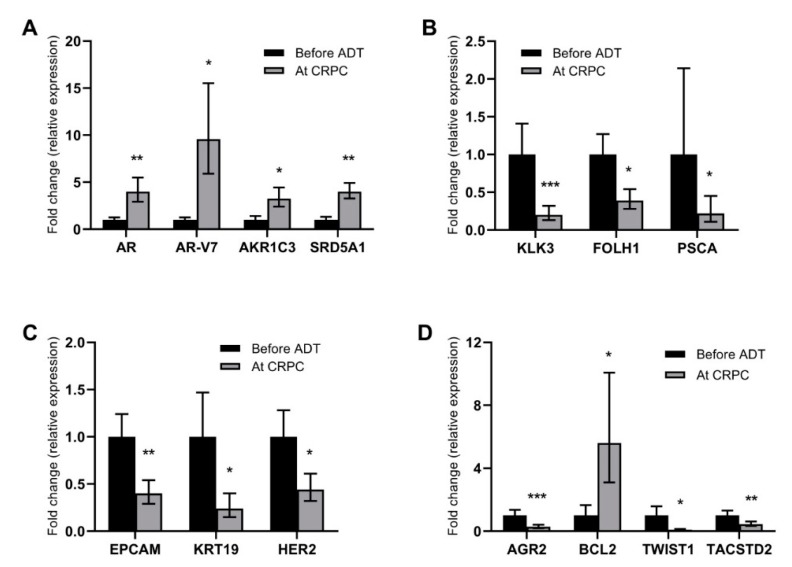
Figure 1.
Genes with altered gene expression at CRPC relapse. Graphs illustrate differences in gene expression levels in paired CTCs sampled before ADT (black bars) and at CRPC relapse (grey bars). Differences are displayed as relative changes (fold change) in relation to levels before ADT for (A) genes related to androgen signaling; (B) prostate markers; (C) genes related to epithelial phenotype; and (D) other genes with altered expression levels. Bars represent mean fold change ± standard error of the mean (SEM); the black bars for before ADT always shows 1 ± SEM by definition of the method. Statistically significant differences are denoted with * = p < 0.05, ** = p < 0.01, and *** = p < 0.001.

