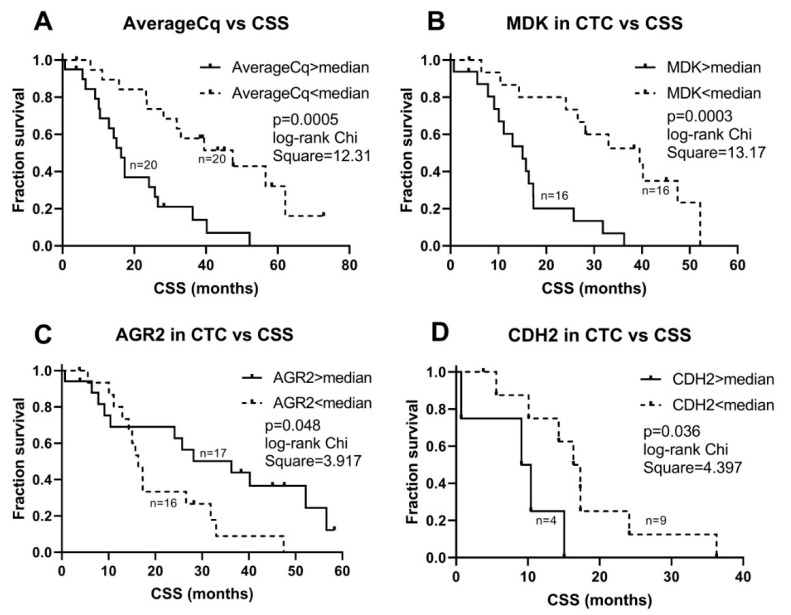
Figure 2.
Survival plots of dichotomized CTC acquired parameters. Graphs illustrate Kaplan–Meier statistics of (A) average signal strength (mCq) as a proxy for CTC content, (B) midkine (MDK) gene expression in CTCs (normalized to AverageCq), (C) AGR2 expression in CTCs (normalized to Average Cq), and (D) N-cadherin (CDH2) expression in CTCs (normalized to Average Cq), in relation to cancer-specific survival (CSS). Parameters are grouped as higher or lower than their respective median values.

