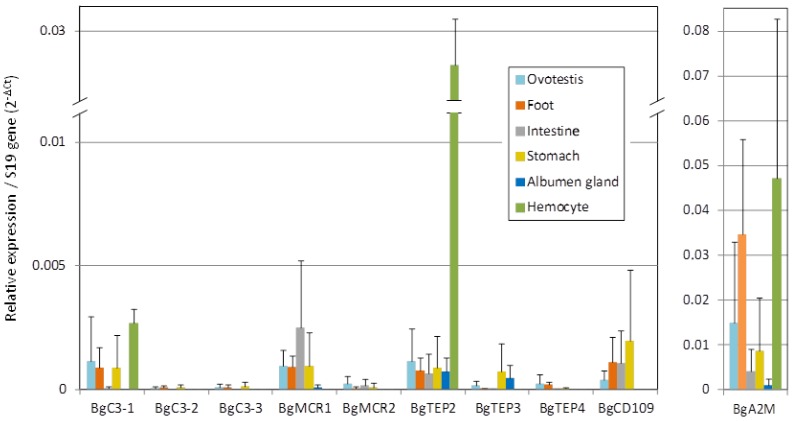
Figure 4.
Relative expression of BgTEP genes in snail tissues. Transcription profile of BgTEPs in different tissues derived from nine individual snails. Six snail tissues were dissected: Ovotestis, head-foot, intestine, stomach, albumen gland. Six pools of hemocytes were each collected from 20 snails. Quantitative RT-PCR was performed on mRNA. Ct values of transcripts were normalized to the transcript level of the reference S19 ribosomal protein gene. Error bars represent the SD of the ΔCt mean values obtained for each tissue. BgA2M is presented apart as transcripts level reaches a different scale.

