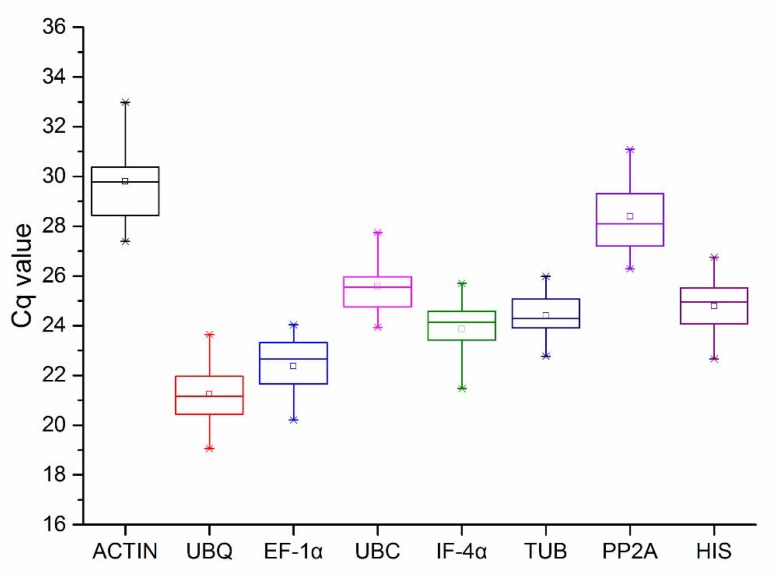
Figure 3.
The Cq values of eight genes in all samples. The asterisk in the figure represents outliers, the line across the box represents median, the box represents a range of 25 to 75% in the value of Cq, and the extension lines at the top and bottom represent a range of 5 to 95%, with different levels of abundance for each reference gene transcript. Cq: quantification cycle.

