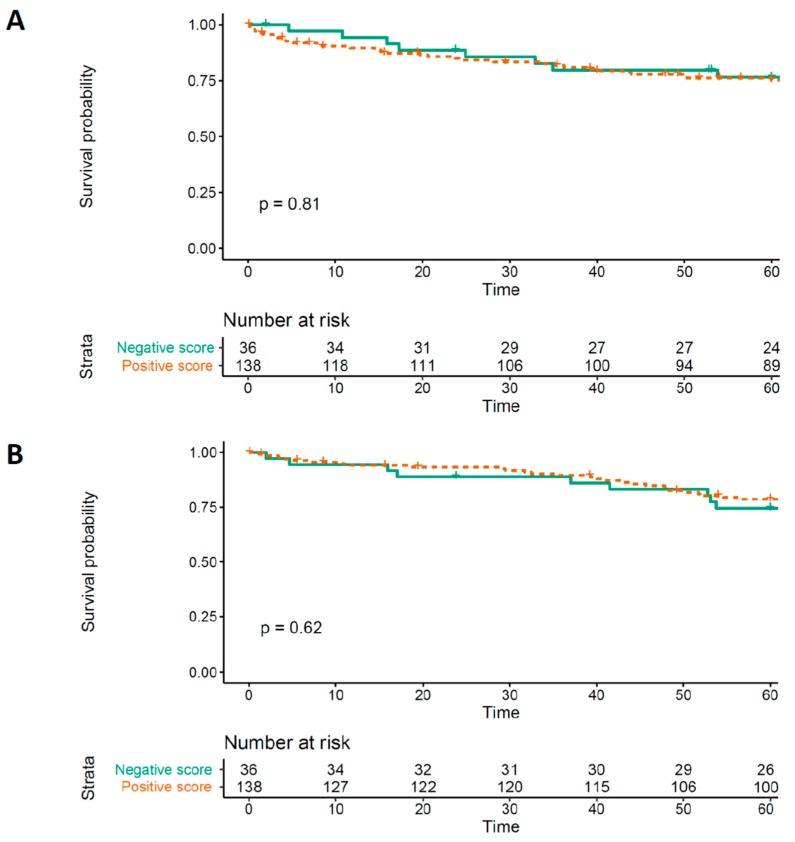
Figure 2.
(A) Kaplan–Meier curve assessing MOR-1 expression effect on Disease free survival (DFS). (B) Kaplan–Meier curve assessing MOR-1 expression effect on overall survival (OS). MOR-1 score is dichotomized as positive when tumor tissue had higher expression than non-tissue tumor in the same patient’s samples and negative otherwise. The curves are fitted on data with imputed missing values. MOR-1: Type 1 mu opioid receptor.

