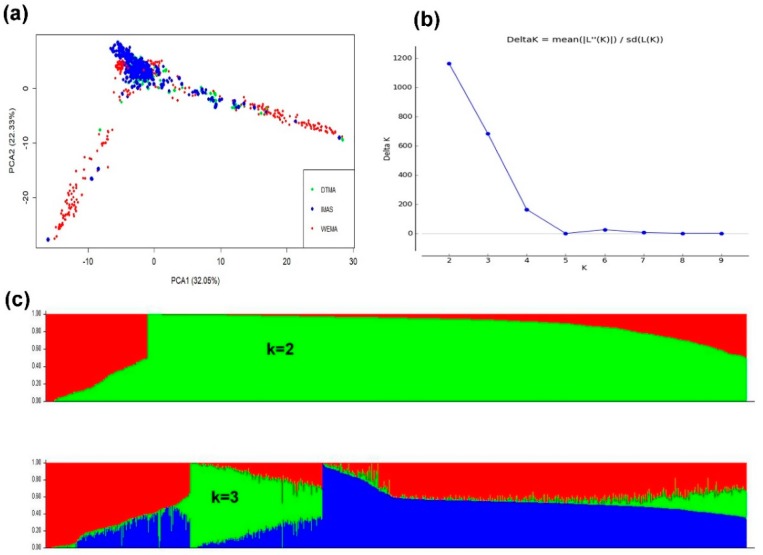
Figure 2.
Population structure and PCA plot of 914 maize inbred lines estimated from 5085 SNPs. (a) PCA plot for the entire population and colored by the group divisions (DTMA, IMAS, and WEMA). (b) Plot of Delta K was calculated for K = 2 to K = 9. (c) Population structure of the lines for K = 2 and K = 3.

