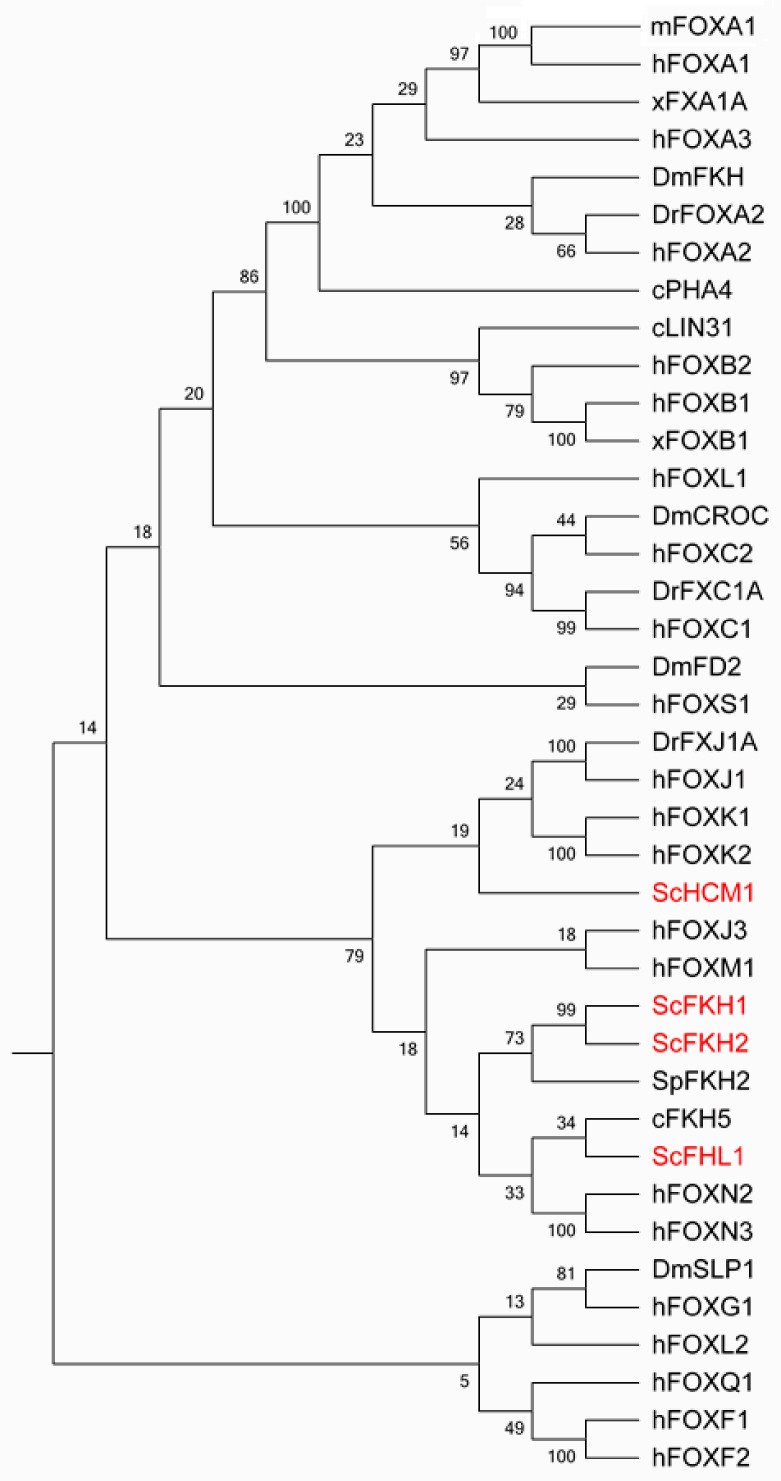
Figure 1.
Phylogeny tree of representative forkhead box (Fox) transcription factors (TFs) from the primary model eukaryotic organisms based on the amino acid sequence of the forkhead domain. The evolutionary history was inferred using the neighbor joining method in MEGA7. The bootstrap consensus tree inferred from 100 replicates was taken to represent the evolutionary history of the taxa analyzed. Branches corresponding to partitions reproduced in less than 50% bootstrap replicates are collapsed. The percentage of replicate trees in which the associated taxa clustered together in the bootstrap test (100 replicates) are shown next to the branches. The evolutionary distances were computed using the Poisson correction method and are in the units of the number of amino acid substitutions per site [3]. Sc: Saccharomyces cerevisiae, Sp: Schizosaccharomyces pombe, c: Caenorhabditis elegans, Dr: Danio rerio, Dm: Drosophila melanogaster,m: Mus musculus, x: Xenopus Laevis, h: Homo sapien.

