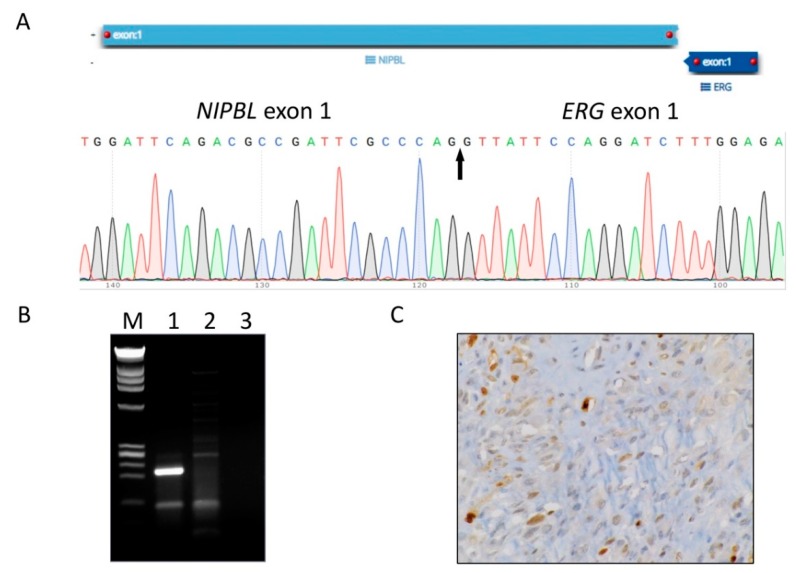
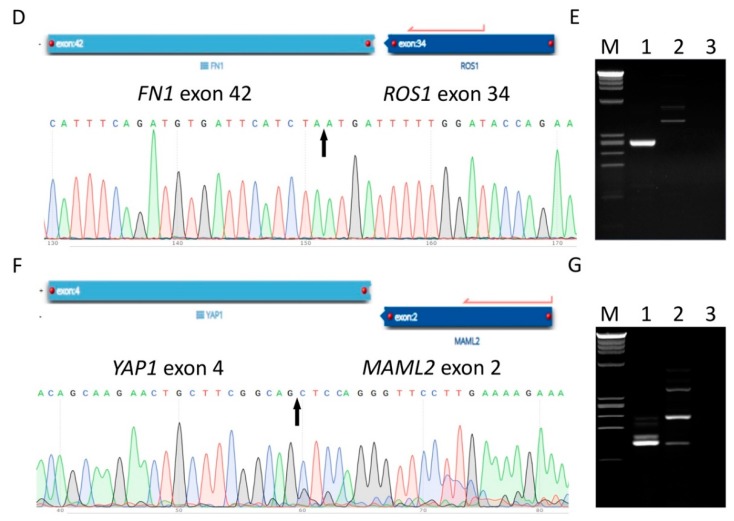
Figure 3.
Discovery and validation of the novel gene fusions in atypical TGCTs. A partial sequence chromatogram is shown from each fusion transcript, with the arrow depicting the fusion breakpoint. Gel electrophoresis images display respective cDNA fragment amplification. A positive band can be seen in Lane 1, supporting the presence of the fusion product. M, DNA marker (Promega, Madison, WI, USA); Lane 1, patient case; Lane 2, HapMap normal RNA control; Lane 3, no template control (water control). (A,B) Identification and validation of NIPBL-ERG fusion transcript by anchored multiple PCR (AMP), Sanger sequencing, and RT-PCR. (C) ERG overexpression in the mononuclear tumor cells by immunohistochemistry (IHC). Identification and validation of FN1-ROS1 (D,E) and YAP1-MAML2 (F,G) fusion transcripts by AMP, Sanger sequencing, and RT-PCR.


