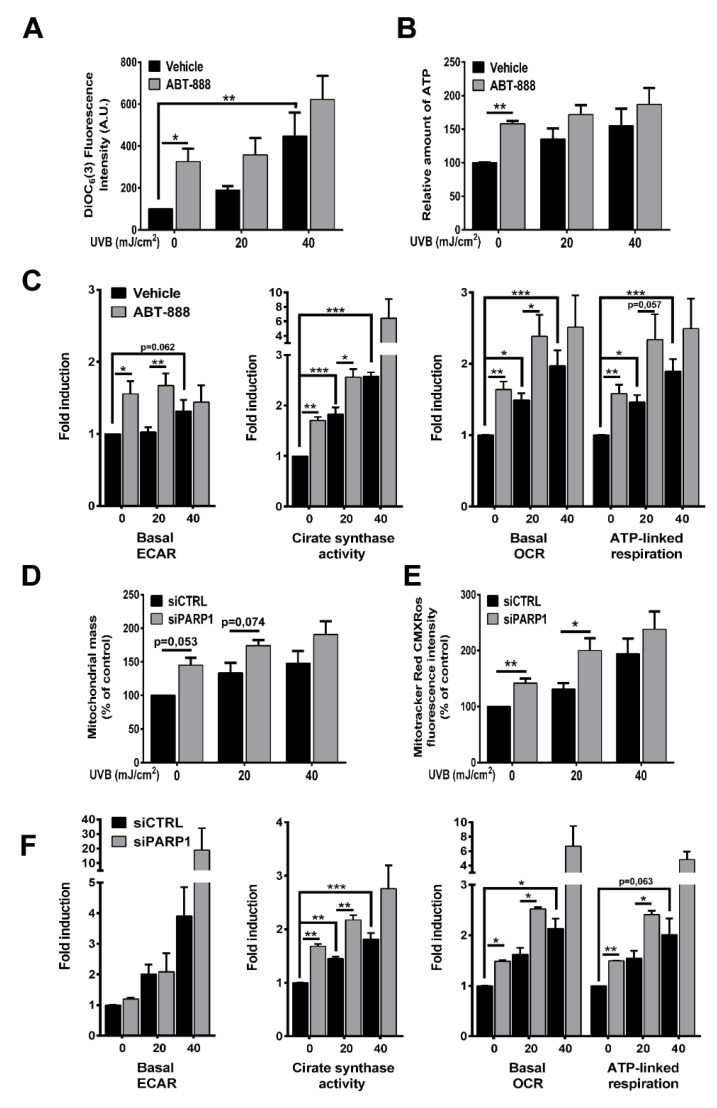
Figure 6.
PARP inhibition boosts UVB-mediated mitochondrial bioenergetic changes. (A) For determination of mitochondrial membrane potential cells were stained with 3,3′-dihexyloxacarbocyanine iodide (DIOC6(3)) 24 h post-UVB and measured by flow cytometry in FL1 channel (n = 4). (B) Total cellular ATP level was quantified by colorimetric assay (n = 3). (C) Basal extracellular acidification rate (ECAR) represents glycolysis after 24 h post-UVB. XF medium was supplemented with 10 mM glucose (n = 6). After four oxygen consumption rate (OCR) measurement oligomycin and antimycin was used to determine mitochondria-linked ATP production and basal OCR, respectively (n = 6). Citrate synthase activity, the initial enzyme of the tricarboxylic acid (TCA) cycle was measured by citrate synthase kit (n = 3). (D) Mitochondrial mass determined similarly as in Figure 3F (n = 4). (E) Mitotracker Red CMXRos mean fluorescence intensity was measured by flow cytometry (n = 4). (F) Metabolic parameters including glycolysis, citrate synthase activity, and oxidative phosphorylation (OPXHOS) was detected similarly as in Figure 6C (n = 2 for ECAR and OCR, n = 3 for citrate synthase (CS) activity). * p < 0.05, ** p < 0.01, *** p < 0.001.

