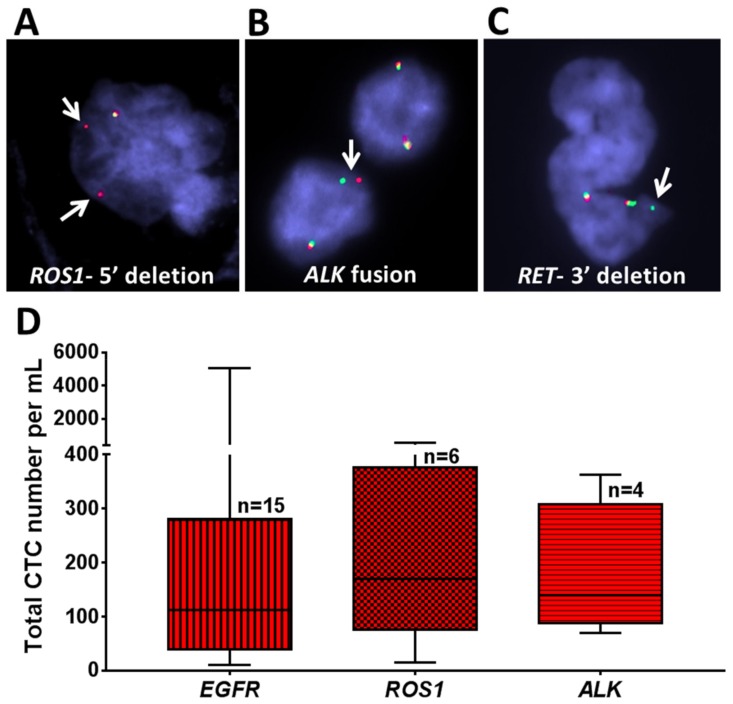
Figure 5.
Genomic analysis of NSCLC patient samples using fluorescence in situ hybridization (FISH) analysis. (A–C) Recovered CTCs from selected patient samples with different mutations (ROS1, ALK, and RET) were evaluated. (A) A patient with ROS1 rearrangement showed 5′ deletion in some of the cells. (B) A patient with aberration in ALK showed ALK fusion. (C) A patient with aberration in RET showed 3′ deletion. Arrows indicate specific aberration in each gene. (D) Box plot of the total number of CTCs recovered from patients with different mutations (EGFR (n = 15), ROS1 (n = 6), and ALK (n = 4)). Analyses were conducted using GraphPad Prism.

