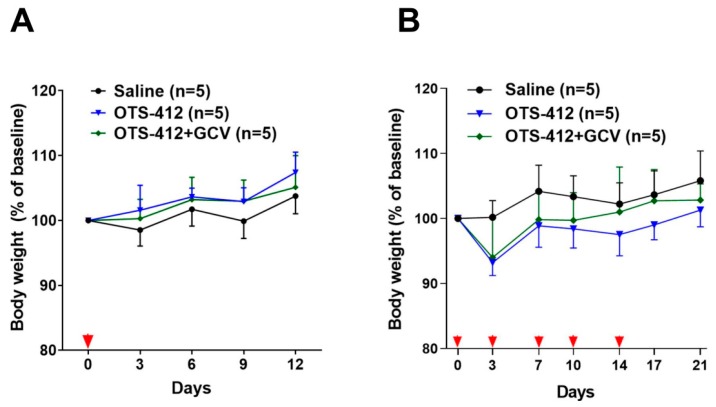
Figure A3.
Body weight in two HCT 116 tumor-bearing mouse models. (A) (Study STG) Body weight measured from day 0 to day 12, post single-dose injection of saline, OTS-412 (day 0, IT, 1 × 10⁶ PFU), or OTS-412 + GCV (day 0, intratumoral [IT], 1 × 10⁶ PFU + once/day, day -3 to 11, intraperitoneal [IP], 25 mg/kg/mice, respectively). (B) (Study MVG) Body weight measured from day 0 to day 21, after multiple-doses of saline, OTS-412 (on day 0, 3, 7, 10, and 14, IP, 1 × 10⁸ PFU), or OTS-412 + GCV (0, 3, 7, 10, and 14, IP, 1 × 10⁸ PFU + once/day, day 0 to 20, IP, 50 mg/kg, respectively).

