Figure 1.
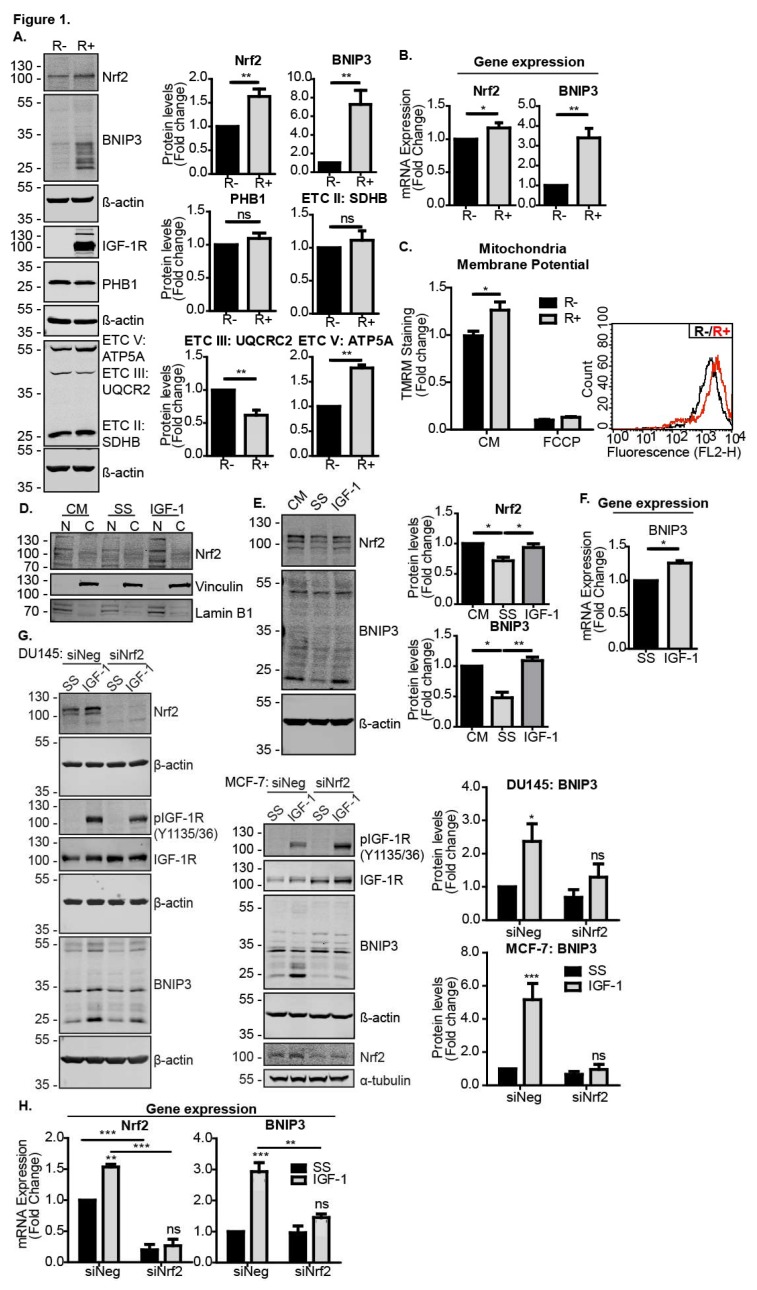
IGF-1-induced BNIP3 expression is Nrf2-dependent. (A) Western blot showing levels of Nrf2, BNIP3, PHB1 and OXPHOS components in R− and R+ cells in the control medium (CM). (B) Gene expression levels of Nrf2 and BNIP3 in R− and R+ cells in the CM measured using RT-qPCR. (C) Mitochondrial membrane potential measured using flow cytometry in R− and R+ cells using TMRM dye. The average geometric means are shown as a relative fold change compared to R− set to a value of 1 for the first biological repeat. FCCP positive controls were included. A representative graph illustrating the fluorescence intensity of R+ cells (red) overlaid onto R− cells (black) is also shown. (D) Western blot showing Nrf2 levels in nuclear (N) and cytosolic (C) fractions of MCF-7 cells maintained in a control medium or serum starved for 4 h followed by 4 h of IGF-1 stimulation (10 ng/mL). (E) Western blot showing Nrf2 and BNIP3 levels in DU145 cells. The cells were kept in the CM or serum-starved for 4 h prior to the addition of IGF-1 (10 ng/mL) for 20 h. (F) Gene expression levels of BNIP3 in U2OS cells measured using RT-qPCR. The cells were serum-starved for 4 h prior to stimulation with IGF-1 (10 ng/mL) for 20 h. (G) MCF-7 and DU145 cells were transfected with siNeg or siNrf2. At 48 h post transfection, the cells were serum-starved for 4 h prior to the addition of IGF-1 (10 ng/mL) for 20 h. (H) Gene expression levels of Nrf2 and BNIP3 in MCF-7 cells transfected with siNeg or siNrf2 measured using RT-qPCR. At 48 h post transfection, the cells were serum-starved for 4 h prior to addition of IGF-1 at 10 ng/mL for 20 h prior to RNA extraction. In all panels, the data were derived from three independent experiments. For Western blots, protein levels were normalised to β-actin and presented as a fold change relative to the control sample set to a value of 1. For RT-qPCR, gene expression levels were normalised to the housekeeping gene UBC (human cell lines) or β-actin (MEFs) and presented as a fold change relative to control conditions set at a value of 1. Statistical analysis was performed using the Student’s t-test (A–C,F), one-way ANOVA (E) or two-way ANOVA (G,H) (*: p < 0.05, **: p < 0.01, ***: p < 0.001). ATP5A: ATP Synthase F1 Subunit α, ETC V: Electron transport chain, SDHB: Succinate dehydrogenase complex iron sulfur subunit B, UQCR2: Ubiquinol-cytochrome C reductase core protein 2.

