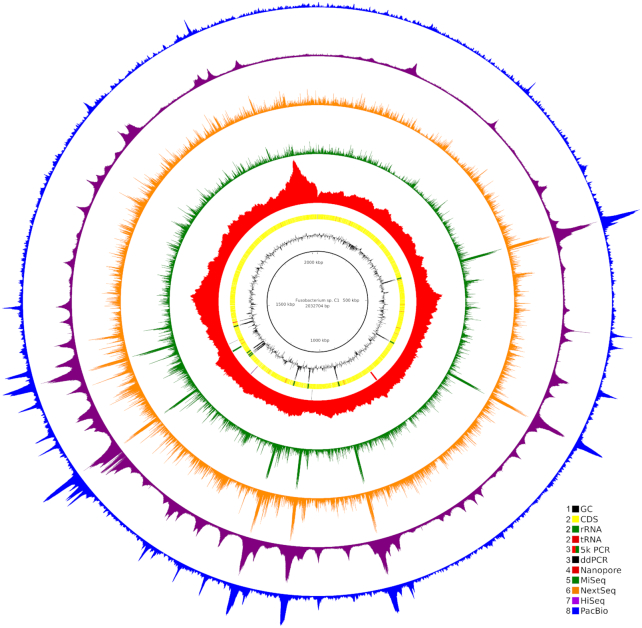
Figure 1:
Coverage biases in the sequencing of Fusobacterium sp. C1. The circle plot shows from the inside: GC content (Ring 1); positions of CDSs, rRNAs, and tRNAs (Ring 2); positions of the PCR targets for ddPCR and the 5.3-kb PCR products (Ring 3); and coverages of Nanopore, MiSeq, NextSeq, HiSeq, and PacBio reads (Rings 4–8, respectively). The circles are numbered from the inside. The GC content plot is centred on the median GC content, with GC contents greater than the median extending outwards. The coverage data are plotted in 50 nt windows, with separate linear scales for each dataset.

