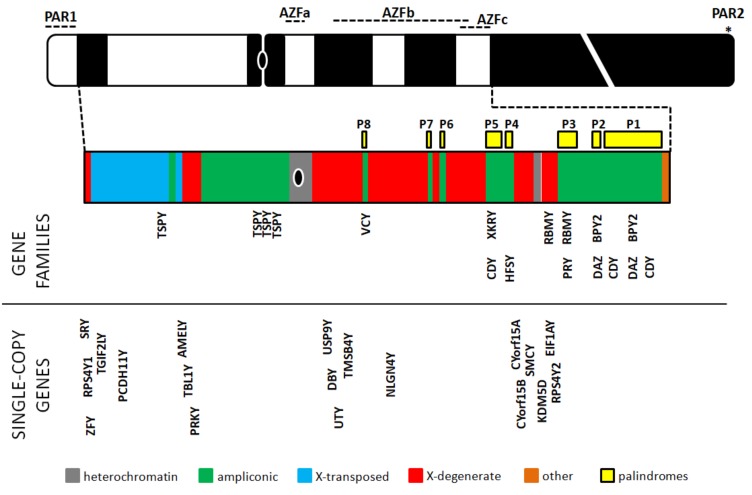
Figure 2.
Organization of the euchromatic portion of the MSY region (MSYe). The picture also reports the localization of the palindromic regions P1–P8 and, for comparison with Figure 1, also PARs and AZF regions. The black oval indicates the centromere. The region q12 is shortened (white cut), due to its large extension compared to the rest of the chromosome. The colored MSYe region is slightly enlarged compared to the Y chromosome (grey lines) to enhance the readability. Gene families and single-copy genes are reported according to [128], with minor modifications.

