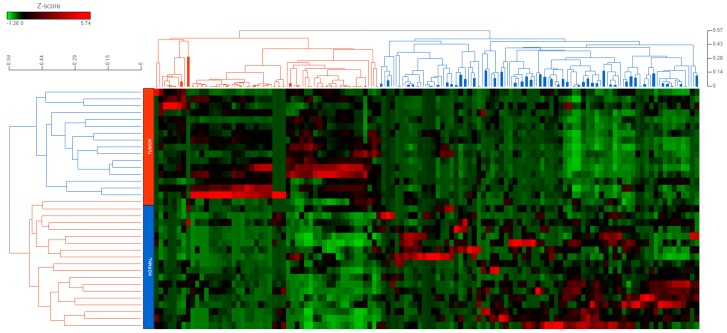
Figure 1.
Hierarchical clustering of differentially expressed piRNAs in colorectal cancer. A total of 143 differentially expressed piRNAs (−2 ≥ fold-change ≥ 2; p < 0.05) in colorectal cancer (CRC) vs. non-malignant colon tissue were hierarchically clustered together using an average-linkage-based cluster distance metric and Pearson correlation as the point distance metric. Rows represent tissue specimens (Blue—normal tissue; Red—tumor tissue), while the columns represent the differentially expressed piRNAs. As per the Z-score color coding, red represents a high expression, whereas green represents a low expression of a given piRNA.

