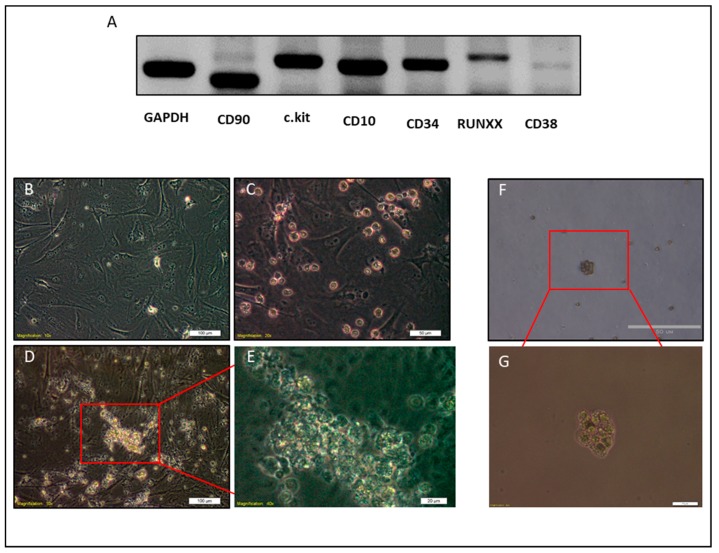
Figure 4.
Molecular phenotyping and clonogenic test of NACs. (A) Agarose gel electrophoresis of NAC transcripts amplified by RT-PCR. (B–E) Representative images of clonogenic test on MEFs, (B) MEFs cells before seeding of NACs (C) MEFs and NACs cells on the day 1. (D,E) Representative images of the colony of NACs after one week of culture on MEFs. F, G) Clonogenic test on semisolid media (methylcellulose). Scale bars represent: (B,D) 100 μm, (C,F) 50 μm, and (E,G) 20 μm.

