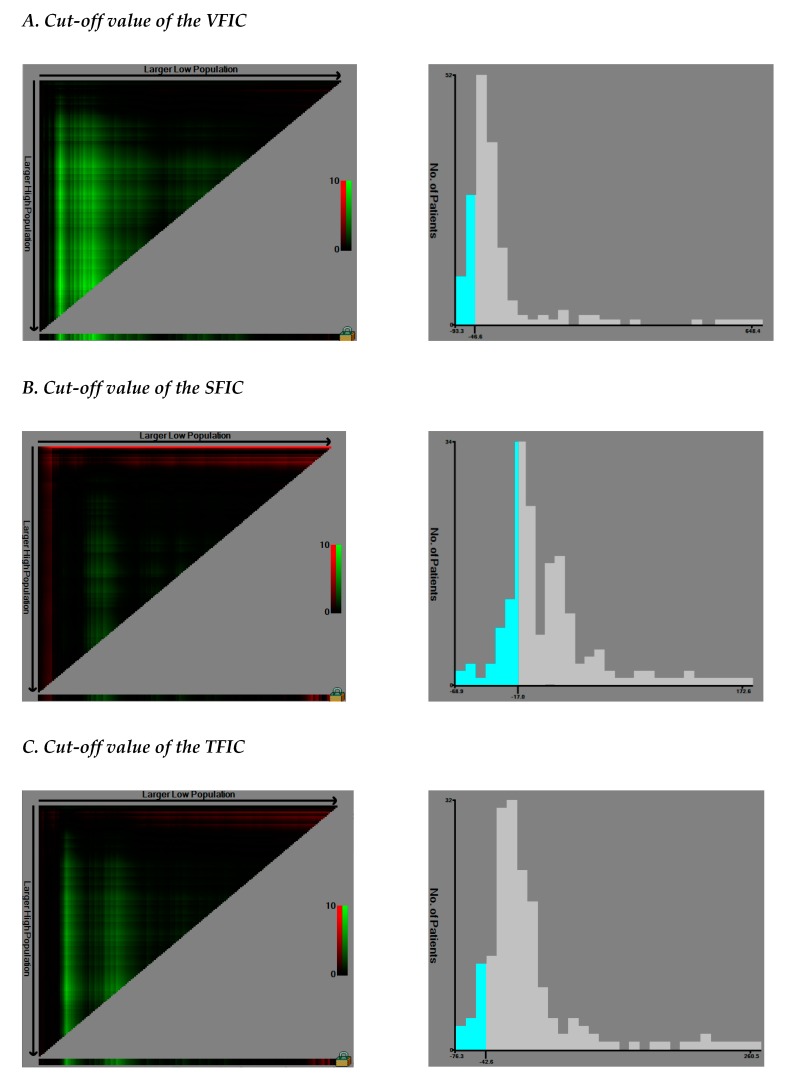
Figure 1.
Determining cut-off values of visceral fat index change (VFIC), subcutaneous fat index change (SFIC), and total fat index change (TFIC) using an X-tile program (n = 167). X-tile plots of the VFIC (A), SFIC (B), and TFIC (C) and the points of the variable coloration of the plot represent the strength of the association at each division ranging from low (dark, black) to high (bright, red or green). Red represents an inverse association between the expression levels and survival of the variables, whereas green represents a direct association. The optimal cut-off values were defined as the values that produced the largest χ2 in the Mantel–Cox test, and these points were set as −46.57 (VFIC) (A), −17.03 (SFIC) (B), and −42.61 (TFIC) (C), respectively. Patients were divided into the two subgroups based on these values on the following survival analysis.

