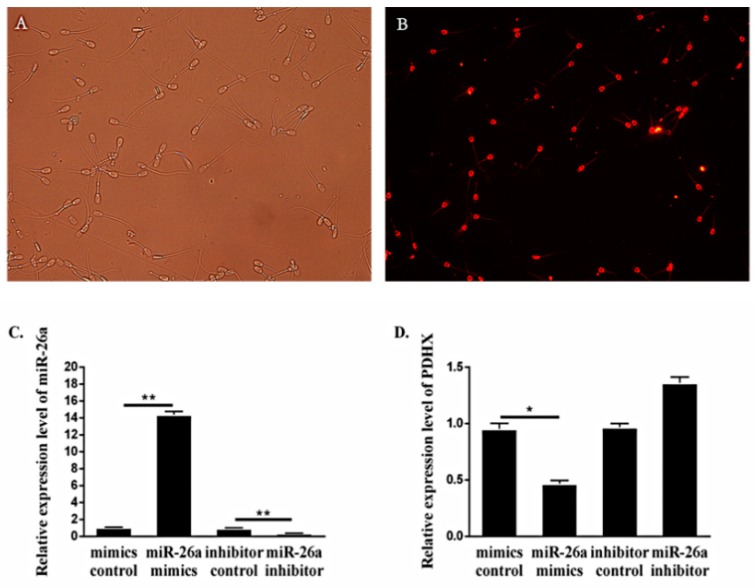
Figure 2.
The transfection efficiency and expression level of miR-26a and PDHX. (A,B) Sperm transfected with mimic negative control (NC) with Cy3 fluorophore under white light conditions and fluorescence conditions, 200×. (C,D) The expression of miR-26a and PDHX after transfection of 6 h, respectively. “*” indicates statistical significance at P < 0.05 and “**” indicates statistical significance at P < 0.01.

