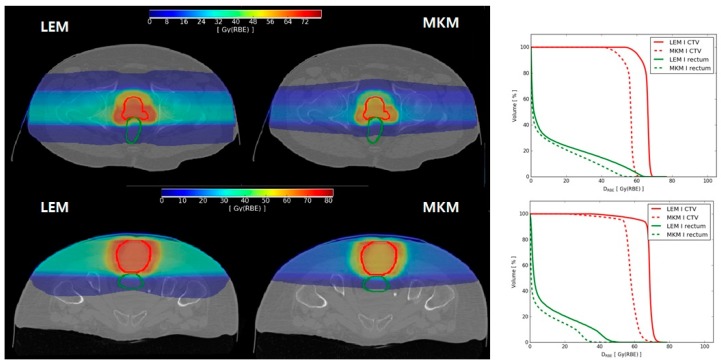
Figure 1.
Left side: axial view of (upper panel) prostate and (lower panel) sacral chordoma patients local effect model (LEM) and microdosimetric kinetic model (mMKM) RBE-weighted dose distributions with clinical target volume (CTV—red line) and rectum (green line) contours. Right side: corresponding dose volume histograms (DVHs) for LEM RBE-weighted dose (DLEM) (solid line) and mMKM RBE-weighted doses (DMKM) (dotted line).

