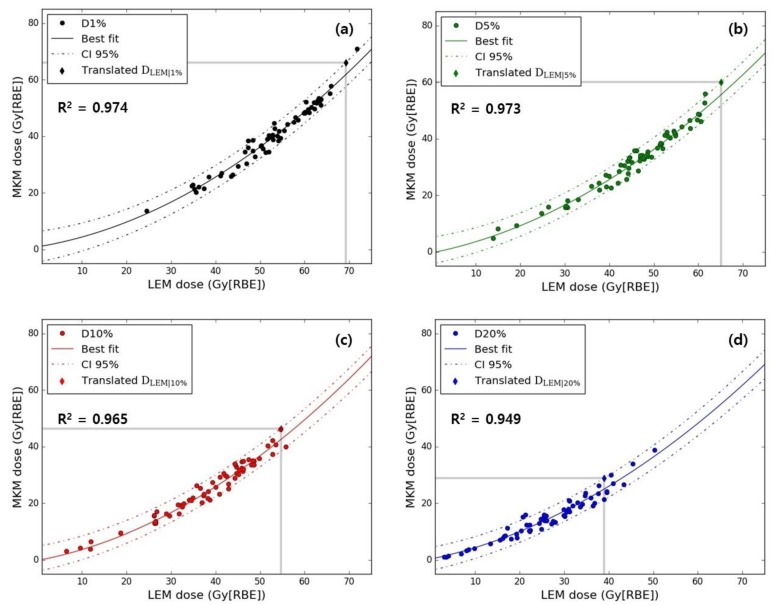
Figure 2.
Rectum DMKM as a function of DLEM for (a) D1%, (b) D5% (c) D10% and (d) D20% are presented with the corresponding fitting functions (solid lines represent the best fits and dashed lines the 95% confidence interval (CI)). Coefficients of determination (R2) for each parameter are given as well. In each plot, grey lines indicate the original DMKM|v constraint and corresponding DLEM|v translation (diamond).

