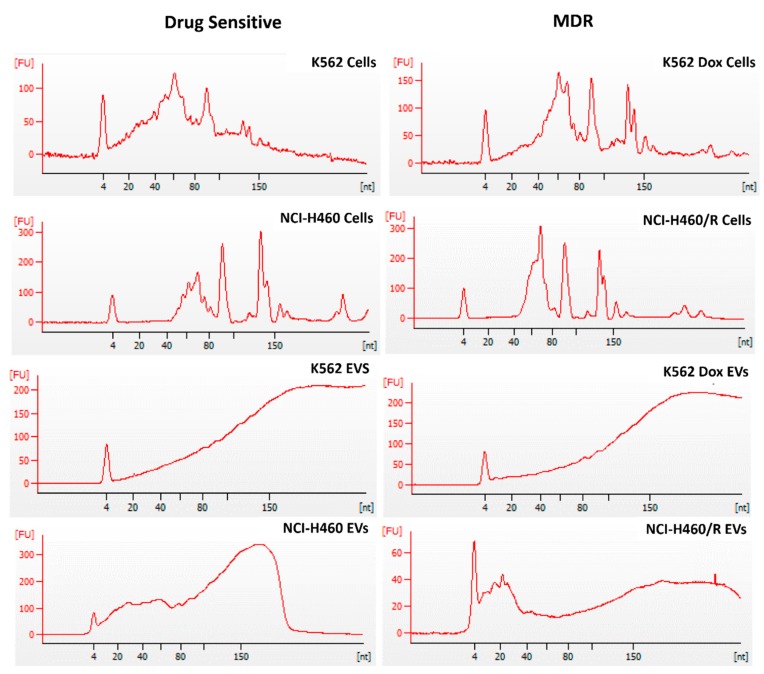
Figure 3.
Profile of small RNAs from drug-sensitive and MDR counterpart cells and from the EVs released by those cells. Cells were from two models: NSCLC (NCI-H460 and NCI-H460/R) and CML (K562 and K562Dox). RNA was analyzed using the Small RNA chip of the Bioanalyzer 2100 Agilent. Images are representative of three independent biological replicates.

