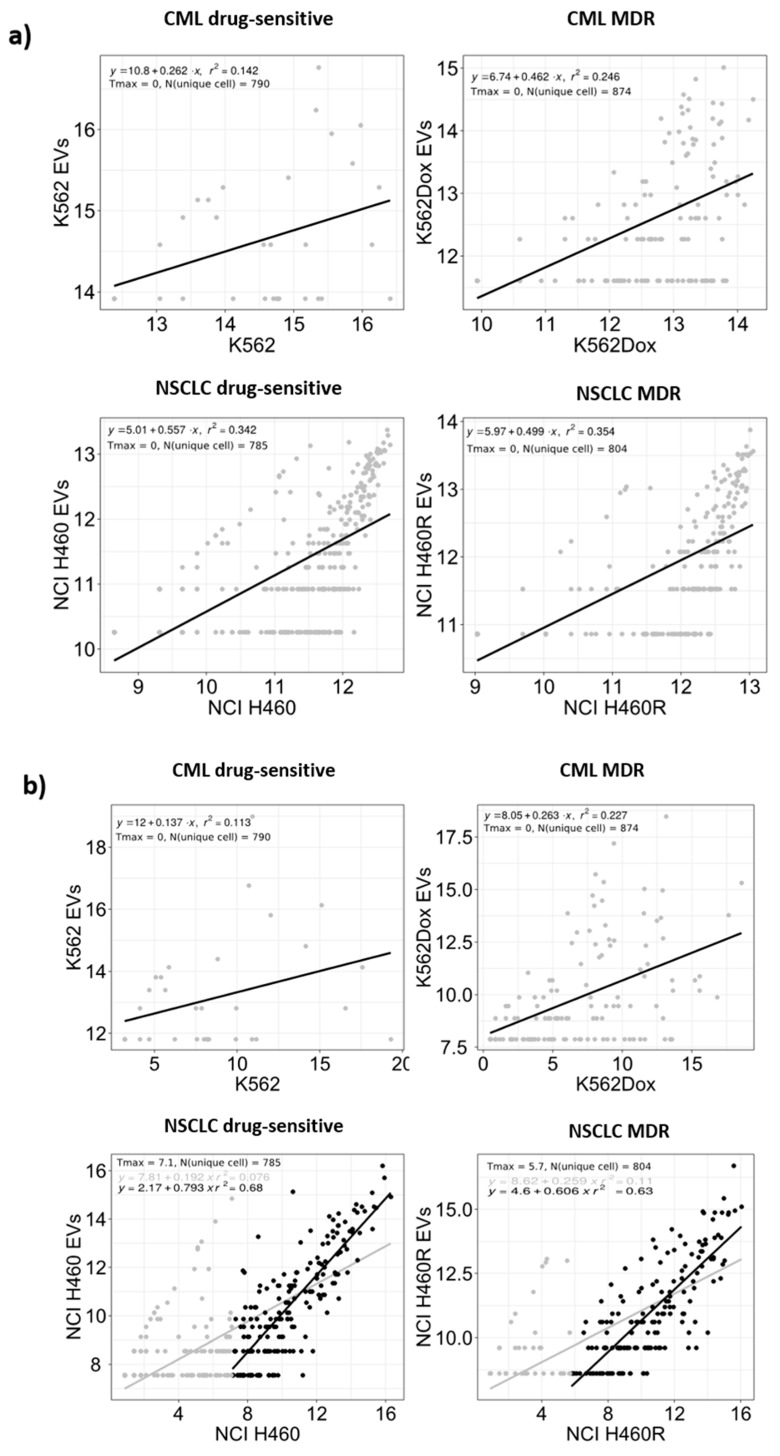
Figure 5.
RNA species (a) and microRNAs (miRs) (b) log2 (RPM) abundance in the extracellular vesicles versus their donor cells. Values are presented on a log2 scale and summarize the results from three independent biological replicates. Tmax indicates the optimized threshold value and N (unique cell) the number of RNAs or miRs with counts in cells, but not in EVs.

