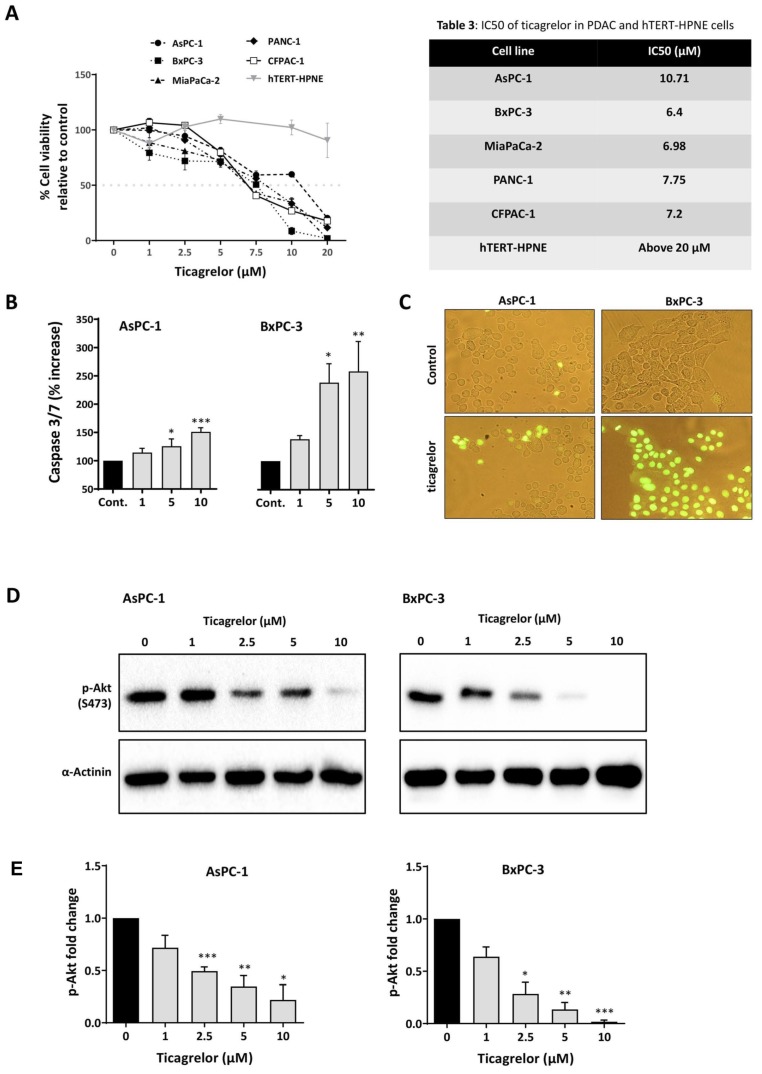
Figure 4.
Ticagrelor treatment reduced PDAC cell viability and enhanced apoptosis through attenuating AKT activation in PDAC cells. (A) Relative cell viability in AsPC-1, BxPC-3, MiaPaCa-2, PANC-1, CFPAC-1 and h-TERT-HPNE cells upon treatment with ticagrelor (0–20 µM) for 72 h (n ≥ 3). Table 2 shows the IC50 (µM) of ticagrelor calculated using GraphPad PRISM 8 and log (inhibitor concentration) versus the normalised response (variable slope). (B) AsPC-1 and BxPC-3 cells were treated with ticagrelor (0–10 µM) for 12 h and analysed for apoptosis (caspase 3/7 activation). The columns represent the fold change in the level of activated caspase 3/7 relative to the control vehicle-treated cells, measured as described in the Methods and Materials section. Data are presented as mean ± SEM. One-way ANOVA with post-hoc Dunnett’s multiple comparison test was used to examine the significance of the mean; n ≥ 4, *** p < 0.001, ** p < 0.002, * p < 0.033. (C) Detection of caspase 3 activity in live cells treated with vehicle or ticagrelor 10 µM for 12 h. The caspase 3 substrate, once cleaved by caspase 3, formed a DNA dye, which stained the nucleus bright green. (D) Immunoblots showing the expression of p-AKT S473 in non-starved AsPC-1 and BxPC-3 cells treated with ticagrelor (0–10 µM) for 1 h. (E) The columns represent the fold change of p-AKT (S473) relative to the control vehicle-treated cells (n ≥ 3). Data are presented as mean ± SEM One-way ANOVA with post-hoc Dunnett’s multiple comparison test was used to examine the significance of the mean. *** p < 0.001, ** p < 0.002, * p < 0.033.

