Figure 2.
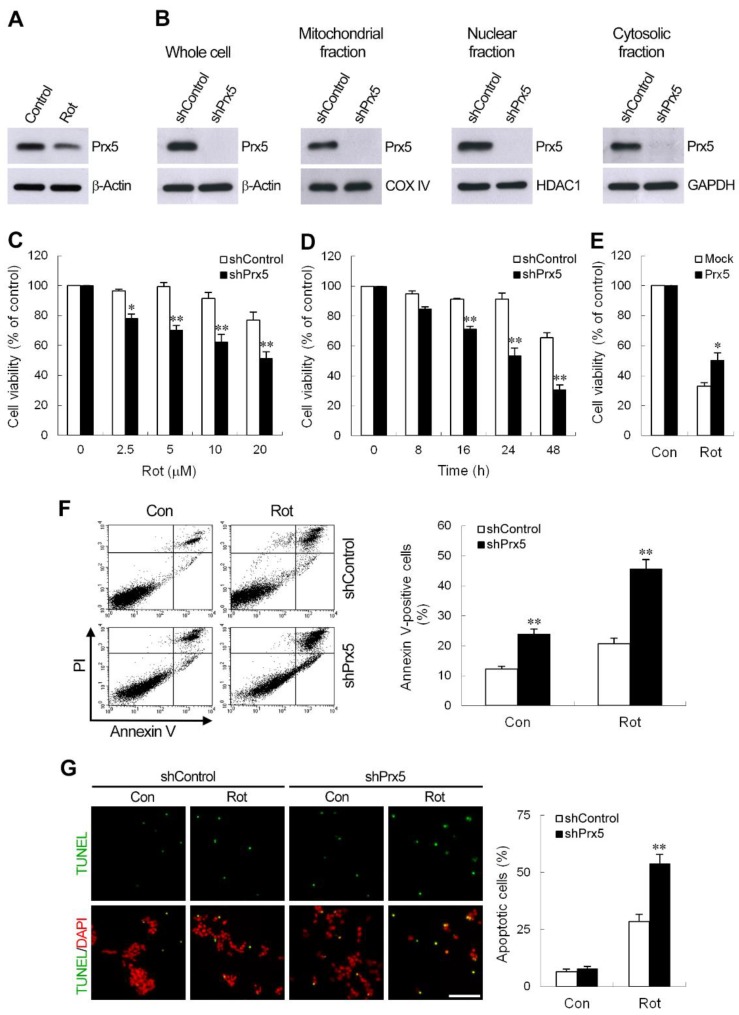
Prx5 depletion resulted in increased sensitivity to rotenone-induced apoptotic cell death. (A) Protein expression of Prx5 in whole-cell lysates was confirmed by western blotting in SH-SY5Y cells treated with 10 μM rotenone for 24 h. (B) Generation of SH-SY5Y clones silencing Prx5. SH-SY5Y cells were stably transduced with lentivirus expressing shRNA against human Prx5 or scramble control sequence. Whole-cell lysates and subcellular fractionations (cytosolic, mitochondrial, and nuclear fractions) were prepared from control and Prx5-depleted cells. The silencing efficiency of Prx5 was determined by immunoblotting. β-Actin, cytochrome c oxidase IV (COX IV), histone deacetylase 1 (HDAC1), and glyceraldehyde 3 phosphate dehydrogenase (GAPDH) immunoblotting was performed to monitor loading for cell lysates, mitochondrial, nuclear, and cytosol proteins, respectively. (C,D) Control and Prx5-depleted cells were treated with various concentrations of rotenone for 24 h (C) or treated with 10 μM rotenone for the indicated times (D). The cell viability was assessed by MTT. Data are presented as mean ± SEM for three independent experiments. * p < 0.05; ** p < 0.01 compared with respective control shRNA-expressing cells. (E) Prx5-depleted cells were transfected for 30 h with a vector containing cDNA of human Prx5 or the empty vector and exposed to 10 μM rotenone. Cell viability was determined at 36 h after rotenone exposure using MTT assay. Data are presented as mean ± SEM for three independent experiments. * p < 0.05 compared with rotenone-treated mock vector-transfected cells. (F) Cells were treated with 10 μM rotenone for 24 h. Cell apoptosis was assessed using flow cytometry with Annexin V-FITC and propidium iodide (PI) double staining. Representative flow cytometry profiles of three independent experiments are shown (left panel). The apoptotic rate was represented by the percentage of Annexin V-positive cells in the total cell population (right panel). (G) Thirty-six hours after treatment with rotenone (10 μM), cells were subjected to TUNEL staining and then examined by fluorescent microscopy. Representative images of TUNEL staining from three independent experiments are shown (left panel). Scale bar = 25 μm. Quantification of apoptotic cells (TUNEL+) is shown as a percentage of the total cell number. Data are presented as mean ± SEM for three independent experiments. ** p < 0.01 compared with respective control shRNA-expressing cells.

