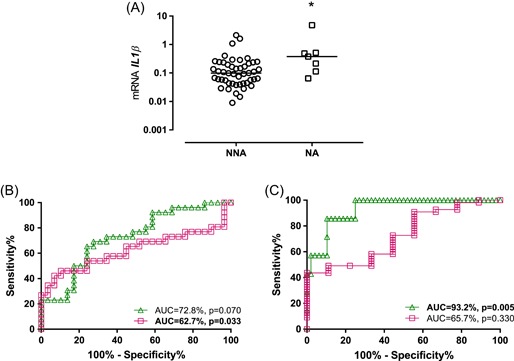
Figure 2.

Gene signatures performance in inflammatory phenotypes of asthma. A, IL1B significantly upregulated in neutrophilic compared with non‐neutrophilic asthma (*P < .05). ROC curves demonstrate that (B) 6GS (green triangle/line) could not predict eosinophilic from noneosinophilic asthma, while TH2S (magenta square/line) showed capacity to predict; (C) 6GS but not the TH2S could predict neutrophilic from non‐neutrophilic asthma. AUC, area under curve; NA, neutrophilic asthma; NNA, non‐neutrophilic asthma; ROC, receiver operating characteristic
