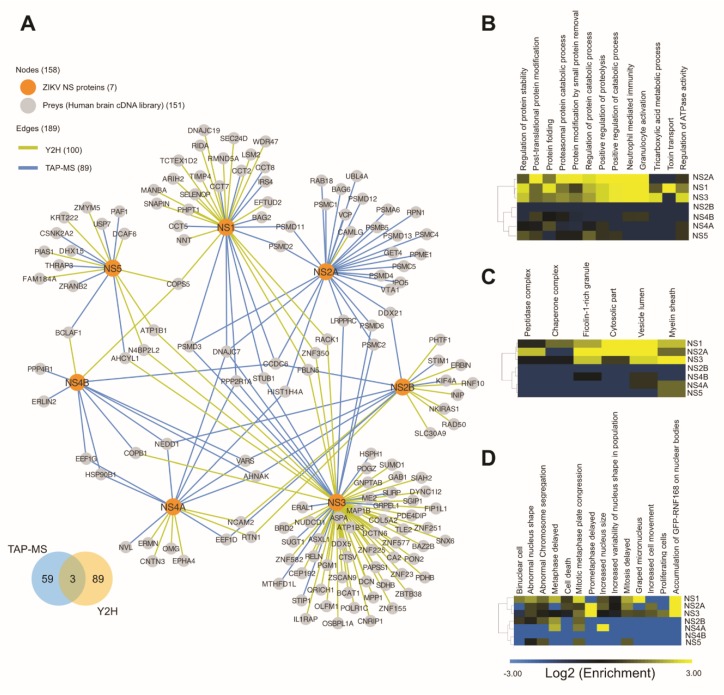
Figure 3.
Merged ZIKV PIN. (A) Network of the interactions identified by Y2H and TAP-MS screens. The color legend is depicted on the upper left-hand corner. (B,C) Clustering of bait sets according to gene ontology (GO) enrichment ratio for biological processes (B) and cellular component (C). (D) Phenoclusters (clustering of bait sets according to enrichment or depletion of Mitocheck phenotype classes. Clustering and visualization were performed using Cluster v3.0 software and TreeView v1.1.6r4, respectively.

