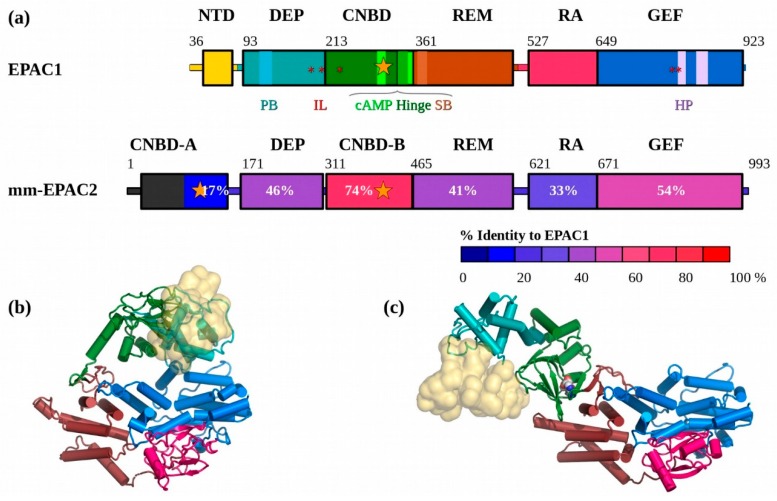
Figure 1.
Domain structure of the EPACs. (a) Top, the EPAC1 domains are shown coloured: N-terminal domain (NTD) (CNBD-A in EPAC2), yellow; dishevelled Egl Pleckstrin (DEP), teal; CNBD (CNBD-B), green; RAS exchange Motif (REM), brown; RAS association (RA), red; guanine nucleotide exchange factor (GEF), blue. Below is the mmEPAC2 sequence coloured by homology (% identity) to EPAC1. EPAC1 lacks cAMP binding in its NTD domain. The other elements highlighted in the EPAC1 sequence are conserved: PB: Polybasic lipid binding loop (cyan), IL: Ionic latch residues (red *), cAMP: cAMP binding site (bright green, orange ★), SB: The “switchboard region” (light shading) which includes the F342 (F435 in EPAC2) Hinge helix (med green), and the HP: Helical hairpin (mauve). (b) The apo-EPAC1 homology model based on EPAC2. (c) The cAMP-bound EPAC1 homology model, showing the rotation of the NTD, DEP, and CNBD domains away from the catalytic domains. The cAMP molecule is shown as space-filling spheres. Models are coloured by domain using the same scheme as shown in (a). The low-homology NTD is shown as a semi-transparent yellow surface for reference.

