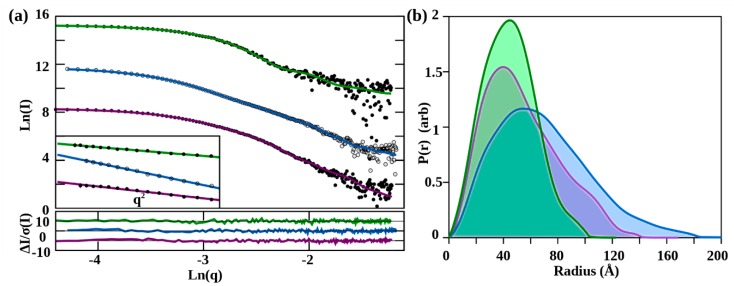
Figure 3.
SAXS data from EPAC1. (a) Log–log plots of the SAXS data (points) with the best rigid-body model fits (lines) for apo-EPAC1 (top, green lines and black dots), cAMP bound-EPAC1 (middle, blue lines and open circles), and EPAC1/Rap ternary complex (lower, purple lines and black dots). The inset shows the Guinier plot (0 ≤ q2 ≤ 0.001 (Å−1)) for each curve, with its linear fit. The rigid-body fitting normalized-residuals are shown below the plot. (All curves are offset for clarity). (b) The P(r) plots. Apo-EPAC1 (green) Dmax = 110 Å, cAMP-EPAC1 (blue) Dmax = 185 Å, ternary-complex (purple) Dmax = 142 Å.

