Figure 5.
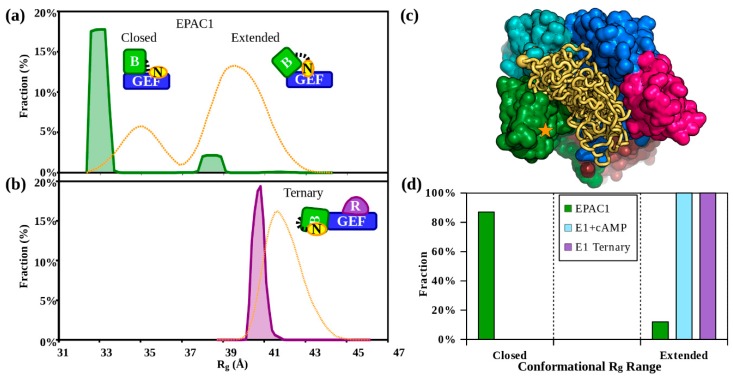
Ensemble of Models analysis of EPAC1. (a) EOM radius of gyration distribution analysis of apo-EPAC1 fitting (Figure S5g) and (b) the Rap1b-bound EPAC1 EOM Rg distribution, based on EPAC2 homology models. Both plots share the same x-axis scale. The apo-EPAC1 distribution is shown in solid green (upper) and the ternary complex in purple (lower). Distribution areas correspond to apo-EPAC1: Peak (EPAC1closed) (fraction 86%, Rg ~32.9 [0.8] Å), Peak (EPAC1extended) (13%, Rg ~38.5 [0.9] Å), and in the ternary complex: Peak (EPAC1ternary) (100%, Rg ~40.7 [0.7] Å). The model distribution pools generated and sampled by EOM are shown as orange dashed lines. (c) This EOM selected ensemble of 12 IDP NTDs (yellow), similarly to the CORAL models (Figures S2 and S3), block the GEF effector binding site (blue), but not the cAMP binding site (★) in the compact, apo-like, (EPAC1closed) conformation. (d) Histograms of the EPAC1 ensembles: apo-EPAC1, cAMP-bound EPAC1, and the EPAC1 ternary complex. The histograms are grouped by Rg range: Into the compact “closed” apo-conformation, or the “extended” cAMP-bound-like conformations, which includes dimer. apo-EPAC1: green; EPAC1 + cAMP: blue; EPAC1 + cAMP + Rap1b: purple.

