Figure 1.
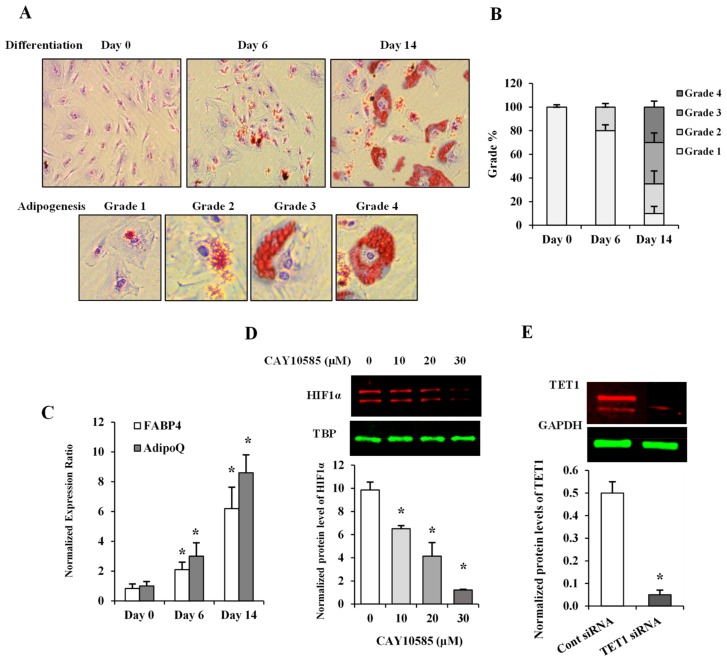
Assessment of adipocyte differentiation and HIF1α and TET1 inhibition in differentiated adipocytes. (A) Microscopic grading of adipocyte differentiation based on cytoplasmic accumulation of lipid droplets by differentiation days 0, 6, and 14 (upper panel; original magnification 10X). Representative images of individual cells with varying degrees of lipid accumulation that reflect different grades of adipogenesis (lower panel; original magnification 20X). (B) A stacked column chart representing the percentage of cells assigned to grades 1-4 in differentiating adipocytes at days 0, 6, and 14. (C) Quantitative assessment by real-time PCR of mRNA levels of FABP4 and AdipoQ normalized to the house keeping gene, β-actin. (D,E) Western blot analysis and quantification of the normalized signal intensity of HIF1α protein in response to increasing doses of the HIF1α inhibitor, CAY10585 (0–30 µM) for 24 h (D) and TET1 protein after incubation with a pool of three target-specific TET1 siRNAs for 7 h (E). Results represent the means ± SD for three independent experiments in triplicates for each treatment (n = 9), (* p < 0.05) for comparison with control.

