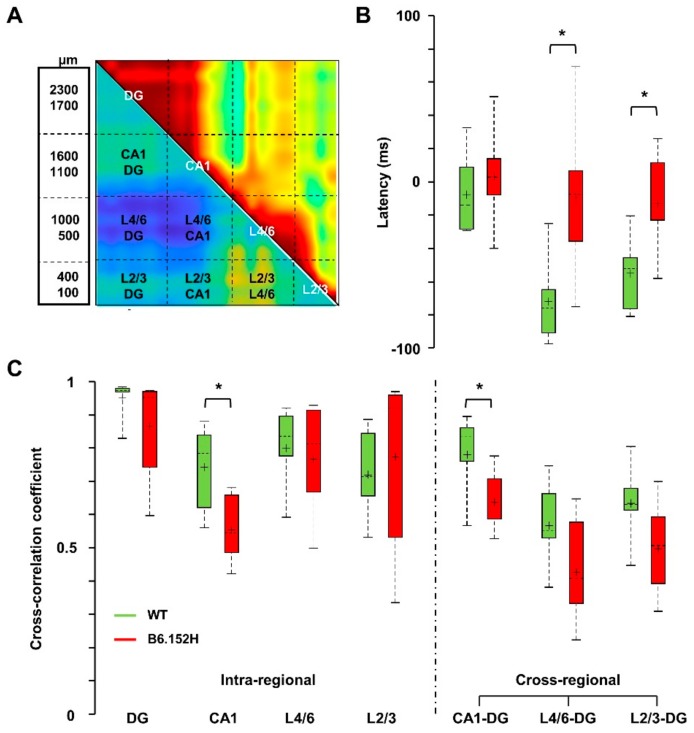
Figure 6.
Loss of SO cortico-hippocampal correlation and latency in young B6.152H mice. For quantitative analyses of regional changes, SO maximal cross-correlation coefficients and latencies of each mouse were averaged within (intraregional) and between (cross-regional) regions, according to the scheme overlaid to the matrices of the three-month-old WT mice (A). Values were then averaged by age and genotype and shown in boxplots as cross-regional latencies (B) and intra- and cross-regional cross-correlation coefficients (C), * p < 0.05.

