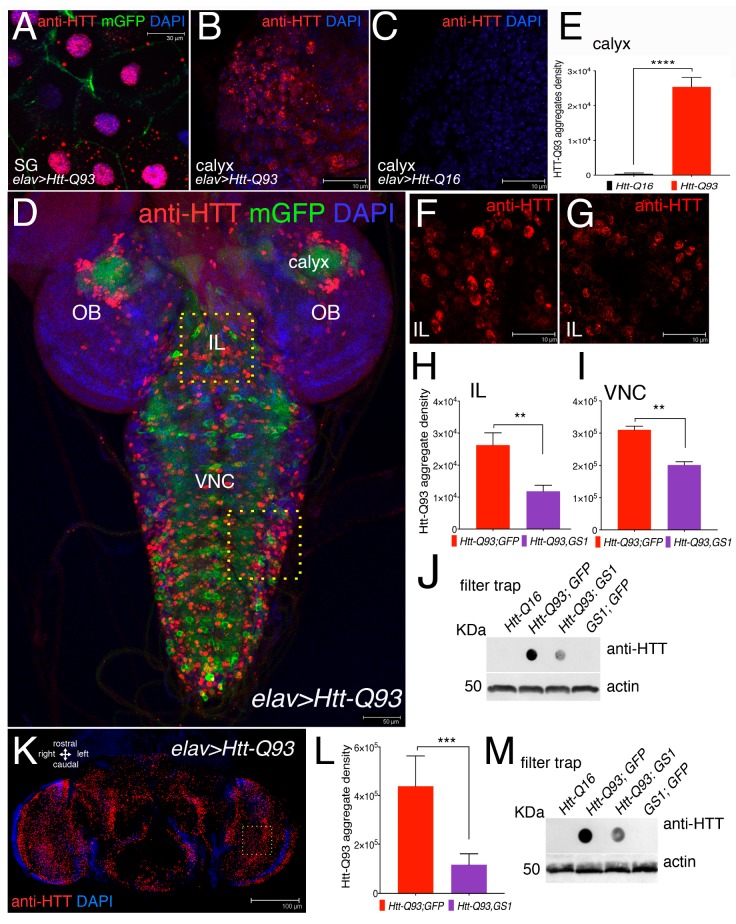
Figure 3.
Expression of GS1 in neurons reduces the presence of Htt-Q93 aggregates. (A) Confocal microscopy images of cells from the salivary gland (SG), where the elav-Gal4 insertion is also transcriptionally active, showing the presence of Htt-Q93 protein aggregates (red), that are visible in the cytoplasm and in the nuclei of cells expressing UAS-Htt-Q93 and UAS-GFP, immunostained with anti-hHtt antibodies. Nuclei are stained with 4′,6-diamidino-2-phenylindole (DAPI); bar 30 µm. (B) Htt-Q93 aggregates visualized in the region from the calyx, (C) that are not detected in the calyx from control Htt-Q16 animals; bar 10 µm; (E) relative quantification of the fluorescence in (B,C). (D) Confocal image of the whole brain from third instar larvae expressing Htt-Q93 and GFP (elav-Gal4; Htt-Q93; mGFP); the Htt-Q93 aggregates are visualized by immunofluorescence and nuclei with DAPI, bar 50 µm. The yellow squares represent the regions where the Htt-Q93 aggregates were quantified: the Ventral Nerve Cord (VNC) and the intralobe region (IL), in addition to the calyx. (F,G) Picture representing the Htt-Q93 aggregates visualized in the intralobe (IL) region from Htt-Q93 (F) or Htt-Q93; GS1 (G) animals; bar10 µm; the relative quantification analysis is shown from the IL (H) and in the Ventral Nerve Cord (VNC) (I). Quantification of the aggregate density was calculated in the relative area and measured as the integrated density of the immunofluorescence signal visualized using anti-human Htt antibody from 10 confocal z-stacks for each animal and elaborated with ImageJ, (see Materials and Methods). (J) Filter trap analysis using lysates from the brains of the indicated transgenes; the expression of actin in the same extracts was analyzed by western blot as an internal control for loading. (K) Confocal image of elav-Gal4; Htt-Q93 adult female’s head at 10 DAE, immunostained with anti-hHtt antibody showing the presence of Htt-Q93 aggregates (RED, nuclei DAPI), bar 100 µm. (L) Quantification of the Htt-Q93 aggregates in the heads of the animals of the indicated genotypes from confocal z-stacks; analysis was performed in the area indicated by the square. (M) Filter trap analysis of Htt-Q93 protein aggregates using lysates from the heads. Actin was used as the internal control. The ** p < 0.01, *** p < 0.001, **** p < 0.0001, values in panels (E,I,J,M) were calculated from Student’s t-test from at least three independent experiments, where error bars indicate the standard deviations. OL = optic lobe.

