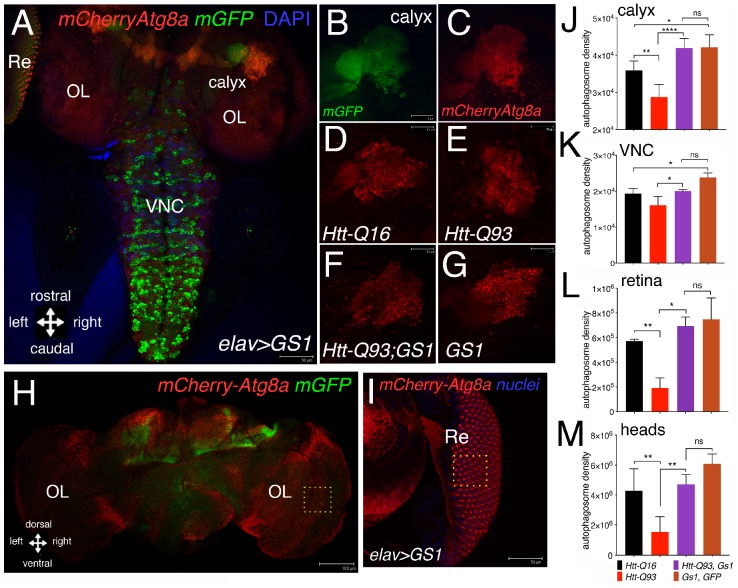
Figure 4.
Expression of GS1 in neurons induces autophagy. (A) Confocal image of whole the brain from a third instar larva showing the pattern of expression for elav-mCherryAtg8a; GFP where the autophagic puncta are marked in red and neurons by GFP; the images represent the pattern of expression of elav-mCherryAtg8a from animals expressing UAS-GS1. (B,C) Insets showing a higher magnification of the right calyx from A; neurons are visualized by elav-GFP. (B) and autophagic puncta by elav-mCherryAtg8a (C); bar 10 µm. Autophagic puncta were analyzed in the region of the calyx (D–G), retina (Re) (I) and in the Ventral Nerve Cord (VNC); OL = optic lobe. (D–G) representative images showing mCherryAtg8a staining in the calyx of the animals at the indicated genotypes, (a higher magnification of these images is shown in Supplementary Figure S10). (H) Image of an elav-mCherry-Atg8a; mGFP female’s head at 10 DAE; OL = optic lobe; bar 100 µm. (I) Image of an eye disc from a third instar elav-GS1 larva co-expressing mCherry-Atg8a in neurons of the retina and in the pigmented cells, with the nuclei stained in blue; bar 50 µm. (J–M) Quantification of autophagy was measured as the integrated density of mCherry-Atg8a and then converted in autophagosome density (see methods). Autophagosome density in neurons of the calyx (J), in the Ventral Nerve Cord (VNC), (K) in the retina (L), and in the adult heads (M) from animals of the indicated genotypes. One-way ANOVA p-values analysis: **** p < 0.0001, ** p < 0.01, * p < 0.05 were calculated from a minimum of five animals, error bars indicate the standard deviations.

