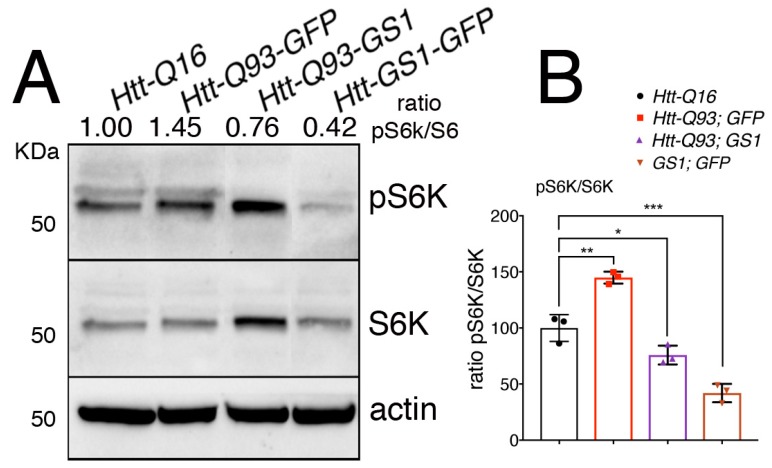
Figure 6.
Expression of GS1 in neurons reduces S6K phosphorylation. (A) Western blot showing the level of phosphorylated S6K on Thr 398 and of S6K in lysates within 10 heads from animals expressing the indicated transgenes in neurons using the elav-Gal4 driver. Actin was used as the loading control. (B) Graphic representing the ratio of S6K phosphorylation versus the unphosphorylated form of the protein. The ratio between pS6K/S6K was calculated from three independent experiments. One-way ANOVA p-values: *** p < 0.001, ** p < 0.01, * p < 0.05 were calculated from three independent experiments, error bars indicate the standard deviations.

