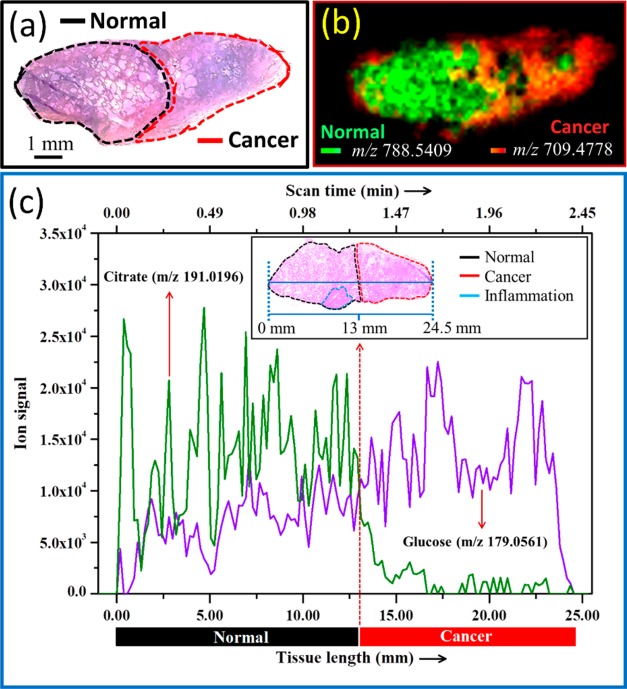
Figure 4.
(a) H&E of a prostate tissue specimen that contains both normal (black outline) and cancer (red outline) areas. (b) Negative ion mode DESI-MSI of the adjacent section (15 μm thickness) mapping the differential distribution of a phosphatidic acid (m/z 709.4778) and a phosphatidylserine (m/z 788.5409) throughout the tissue (overlaid image in bicolor), distinguishing the areas of cancer and normal. (c) Extracted ion chronograms of glucose and citrate over a line scan of a typical prostate tissue specimen (H&E shown in the inset) that contains both normal (black outline) and cancer (red outline) areas.24

