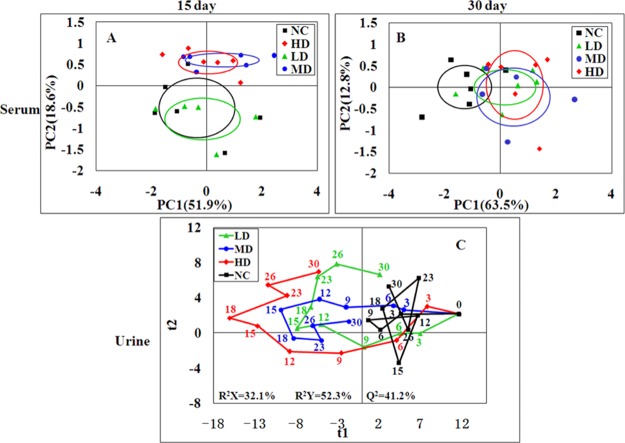
Figure 4.
PCA score plot of serum (A,B) samples from the four groups at day 15 and day 30 and PLS-DA score trajectory plots of urine (C) samples from the four groups at days 0, 3, 6, 9, 12, 15, 18, 23, 26, and 30. Day 0: one day before treatment, days 3–15: the time points of administration, days 18–30: the time points of stop administration. In PLS-DA score trajectory plots, each point represented the mean position of a group (n = 12). NC: normal control group, LD: low-dose group, MD: middle-dose group, HD: high-dose group.

