Figure 7.

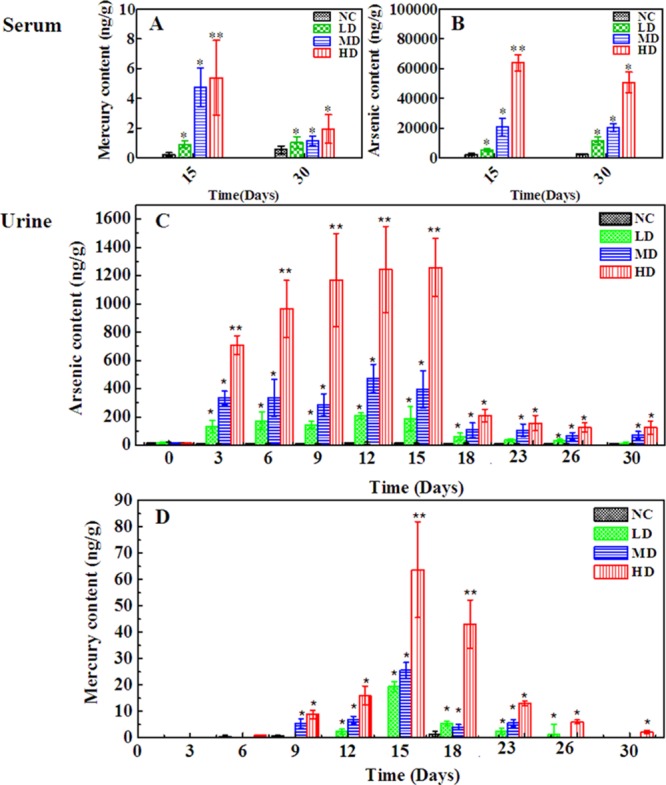
Content of As and Hg in rats serum (A,B) and urine samples (C,D) from the four groups. *p < 0.05, **p < 0.01 vs control group. NC: normal control group, LD: low-dose group, MD: middle-dose group, HD: high-dose group.

Content of As and Hg in rats serum (A,B) and urine samples (C,D) from the four groups. *p < 0.05, **p < 0.01 vs control group. NC: normal control group, LD: low-dose group, MD: middle-dose group, HD: high-dose group.