Abstract
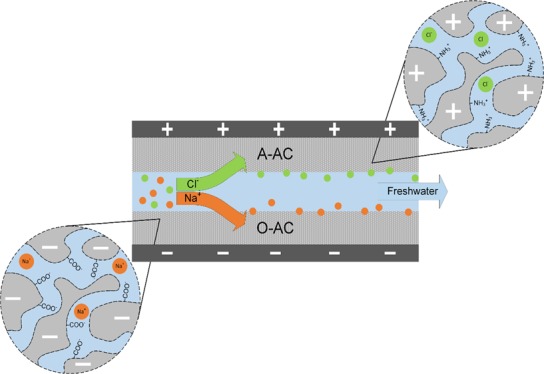
Water softening is a relatively untapped area of research in capacitive deionization (CDI). In this work, we demonstrate how an asymmetric combination of oxidized and aminated carbon can be used for selective removal of divalent cations for water softening. We first show how higher electrosorption performances can be achieved in single-salt experiments involving NaCl, KCl, MgCl2, and CaCl2 before proceeding to multi-salt experiments using different combinations of the four salts. The salt combinations are chosen to investigate one of the three factors: (1) ionic mass, (2) ionic charge, or (3) concentration. We show how divalent selectivity can be achieved due to high local electrostatic attraction between negatively charged oxygen moieties and divalent cations. Additionally, an ion-exchange process between the oxidized carbon surface and cations can result in lower pH values, which prevent the precipitation of scale-forming ions.
1. Introduction
Water containing a high mineral content of calcium and magnesium is considered “hard”. Hard water is particularly vexing in industrial systems where scaling of pipelines or heat exchangers can increase energy overheads, resulting in additional downtime and higher operational costs. As such, several different methods had been developed to decrease the mineral content or “soften” water. These methods can be broadly classified as membrane type (reverse osmosis1 and nanofiltration2,3), electrochemical type (electrodialysis4,5), and chemical type (ion precipitation6 and ion exchange7). Unfortunately, membrane and electrochemical techniques require complicated infrastructure, which are energy intensive and costly to maintain. Chemical methods, on the other hand, are cheap but can create waste products, which require further treatment before disposal. Thus, there is a real need to develop methods, which are effective, cheap to implement, and compatible with the environment.
In recent years, there has been much interest in developing demineralization methods such as capacitive deionization (CDI) for water desalination8−10 and remediation.11−13 Although CDI has been around since 1960s,14 it was only recently highlighted due to the dire state of sanitation and water scarcity.15 The concept behind CDI is to simply charge two electrodes across a channel filled with feedwater, and ions would be adsorbed onto the electrodes. The effluent stream would be devoid of ions, whereas the electrodes would be fully charged. At the end of the adsorption phase, a short-circuit is applied to discharge the electrodes and expel the ions. Because CDI has a much lower energy efficiency than reverse osmosis in desalination applications,16 it is more advantageous to leverage the unique features of CDI (e.g., ease of operation, modest infrastructure, and rapid removal of ions8,17) to specialize water purification applications. In particular, CDI has shown great promise for the selective removal of ionic contaminants such as phosphates,18 sulfates,19 nitrates,11,20,21 arsenic,22,23 and heavy metals.11,24−26
One of earliest works associated with the removal of multiple ionic species was performed by Gabelich et al.27 using carbon aerogels. They investigated the electrosorption performances of Na+, Mg2+, K+, Rb+, Cl–, Br–, NO3–, and SO42– in a series of experiments targeted at ionic charge, mass, and radius. Based on their findings, they concluded that monovalent ions were preferentially adsorbed over divalent ions due to smaller hydrated radii. A later study on anion adsorption28 concurred with Gabelich’s study that hydrated radius was a dominant factor between competing anions in solution. The same study further found that stronger anions such as NO3– could replace Cl– ions already adsorbed on the electrode surface. This phenomenon was also reported by Seo et al.29 who showed how monovalent Na+ can be substituted by divalent ions of Ca2+ or Mg2+. Interestingly enough, divalent ions can also screen electrode charge and prevent monovalent ions from adsorbing at all.30 Although these studies are promising, they rarely discussed the ionic strength of the solutions with respect to their results and largely discounted the influence of electrode properties on ion adsorption. To that end, Han et al.31 investigated the influence of electrode porosity on electrosorption using three different activated carbon cloths. Seven different monovalent solutions were used for their experiments, and their results showed that the ratio between micro- and mesopores was effective in controlling ion selectivity. Besides managing the porosity, doping had also been used to alter the electrostatic attraction between the electrode and ion to improve electrosorption performance. For example, Wei et al.26 showed that S-doped graphene aerogels adsorbed higher amounts of heavy metal than N-doped or undoped graphene aerogels.
In a separate strategy, ion-exchange membranes (IEMs) are employed in conjunction with electrodes to either improve electrosorption performance32 or to selectively remove ions.33−35 A fundamental study by Hassanvand et al.32 explored the differences in electrosorption between CDI and membrane capacitive deionization (MCDI) in multi-salt solutions. Hassanvand et al. discovered that strong electrostatic forces between divalent ions and functional groups in IEMs could result in a desorption rate faster than monovalent ions. They also presented effluent pH results and showed how conventional CDI resulted in high pH values (∼10.5) during adsorption. A high pH value can accelerate scaling effects of divalent cations and cause ion precipitation. MCDI, on the other hand, does not cause significant pH changes since IEMs limit the transportation of ions taking part in faradaic reactions. Other IEMs such as monovalent cation permselective membranes were also used in MCDI to produce divalent cation-rich solutions.33 Although MCDI is indeed promising for applications such as water softening, the high costs of IEMs17 make it difficult to realize in an industrial setting.
In this work, we adopt a strategy of grafting charged functional groups onto activated carbon (AC) to achieve enhanced electrosorption of divalent over monovalent cations. Earlier studies on divalent and monovalent ion adsorption29,31 focused their discussion on unmodified carbon electrodes and neglected the influence of chemical groups bound to the carbon surface. Modification of existing or introduction of new functional groups have been shown to be a cheap and effective way to replace IEMs36−38 and tune the ion-electrode affinity. For example, some studies have reported greater specific adsorption of divalent cations on negatively charged surfaces.39−42 The use of functionalized carbon for selective ion removal was notably reported by Oyarzun et al.43 who showed the selective removal of NO3– over Cl– using AC functionalized with cetyltrimethylammonium bromide (CTAB). Unlike their work, we focus on the adsorption of cations and discuss the electrosorption differences between divalent and monovalent cations using an oxidized cathode paired with an aminated anode. We perform electrosorption experiments in both single- and multi-salt solutions to illustrate the effects of competition between cations and show how ion exchange between surface groups and cations can achieve a low effluent pH. To eliminate possible interference from dissimilar anions, only chloride salts of NaCl, KCl, MgCl2, and CaCl2 were chosen for our experiments.
2. Materials and Methods
Chemicals and reagents used in this study were of analytical grade and used as-received unless otherwise stated. Activated carbon (AC, YP-80F) was obtained from Kuraray Co. Ltd., Japan, and ultrapure water (18.2 MΩ) was provided by an ultrapure water system (arium pro UV, Sartorius).
2.1. Synthesis of Oxidized and Aminated AC
Prior to oxidation, the as-received AC was boiled in ultrapure water at 100 °C for 2 h to remove any possible contaminants leftover from the production process. The clean AC was subsequently dried at 60 °C in a vacuum oven overnight before use. Approximately 300 mg of AC was added to a round-bottom flask containing 50 mL of 7 M HNO3 solution and stirred at 80 °C for 12 h. The mixture was allowed to cool before it was filtered and washed several times with ultrapure water until the pH of the filtrate reached 7. The oxidized AC is henceforth denoted as O-AC. Similarly, clean AC for amination was obtained after boiling with ultrapure water. About 300 mg of AC was dispersed in an acetone solution containing 2.5 mL of (3-aminopropyl)triethoxysilane (APTES, 99%). The mixture was stirred and heated at 70 °C until all acetone had evaporated. The aminated AC is denoted as A-AC.
2.2. Fabrication of Electrodes
Electrodes used in electrochemical and electrosorption experiments were fabricated in similar fashion as previously reported.44,45 A weighed quantity of AC was mixed with polyvinylidene fluoride (PVDF; Mw, ∼180,000), binder, and acetylene black in a mass ratio of 8:1:1 and ground using an agate mortar and pestle. Approximately 3 mL of N-methyl-2-pyrrolidone (NMP, 99.5%) was added to the powdered mixture to form a slurry, which was cast onto graphite sheets (Latech Scientific Supply Pte. Ltd., Singapore), and left to dry in a vacuum oven at 90 °C for 12 h. Cathodes were fabricated using either AC or O-AC, whereas anodes were fabricated using A-AC. The amount of AC used for the cathode depends on the capacitance ratio between AC/O-AC and A-AC. Electrodes used for CDI experiments were 5 × 5 cm2, whereas electrodes used in electrochemical tests were 1 × 1 cm2 with an approximate mass of 2 mg. All electrodes were roll-pressed prior to use to improve contact between the material and graphite substrate. Average coating thickness after being roll-pressed was estimated to be around 25 μm.
2.3. Characterization
Morphology and elemental composition of the AC were characterized using a field emission scanning electron microscope (FE-SEM, JEOL JSM-7600F) equipped with an energy-dispersive X-ray spectrometer (EDS). Surface functionalities were investigated using both Fourier transform infrared spectroscopy (FTIR) and X-ray photoelectron spectroscopy (XPS) techniques. FTIR spectra were obtained using an FTIR spectrometer (Nicolet Nexus 410, Thermo Electron) over a wavenumber range of 4000–400 cm–1 at a resolution of 1 cm–1 operating in the transmission mode. XPS spectra were obtained using a PHI 5400 system equipped with an Al Kα beam source (250 W) and a position-sensitive detector (PSD). XPS results were subsequently interpreted using CasaXPS software (version 2.3.18) after calibrating narrow scan elements to the standard C 1s peak (284.6 eV). Nitrogen adsorption–desorption isotherms were measured at 77 K using an Autosorb-iQ-MP-XR system (Quantachrome) after samples were degassed at 150 °C for 6 h. Specific surface area (SSA) and pore size distribution were determined using a quenched solid state functional theory (QSDFT) method. Total pore volume was calculated at relative pressure close to unity. All calculations were performed using a proprietary software (ASWin, Quantachrome) provided by the manufacturer.
A three-electrode configuration comprising of a working electrode (1 × 1 cm2), a platinum counter electrode (1.5 × 1.5 cm2), and a saturated calomel reference (SCE) as the reference was used for electrochemical characterization. Cyclic voltammetry (CV) measurements were performed in 0.5 M NaCl, KCl, MgCl2, or CaCl2 solution at a scan rate of 5 mV s–1 within a potential window of 0 to 1.0 V, while galvanostatic charge/discharge (GCD) experiments were performed at a current density of 0.1 A g–1 within the same potential window. Specific capacitances were determined from GCD curves using
| 1 |
All electrochemical measurements were performed using the same electrochemical workstation (VMP3, Bio-logic).
2.4. Electrosorption Experiments
Electrosorption experiments were performed using a CDI cell operating in the single-pass mode, a peristaltic pump (HV-77921-65, Masterflex), a programmable sourcemeter (SMU 2450, Keithley), and a pH meter (S220 SevenCompact, Mettler Toledo). The CDI cell was assembled in an asymmetric configuration where the electrodes are composed of dissimilar materials13,40,46 (cathode was composed of either O-AC or plain AC, and anode was composed of A-AC (Figure 1b)). An acrylic separator layer separates the two electrodes to allow feedwater to flow through, and the whole ensemble was housed in acrylic plates secured by stainless steel screws. A 1 V potential was applied to adsorb the salt, and a short-circuit was used to regenerate the electrodes. Water travels from a 5 L feedwater tank to the CDI cell then to a 10 mL holding tank before circulating back to the feedwater tank. pH readings were obtained near the exit port of the CDI in the holding tank at intervals of 1 min. A schematic of this operation is provided in Figure 1a. Operational parameters such as flow rate (25 mL min–1), adsorption or desorption time (15 min), and solution temperature (298 K) were kept constant in all experiments.
Figure 1.
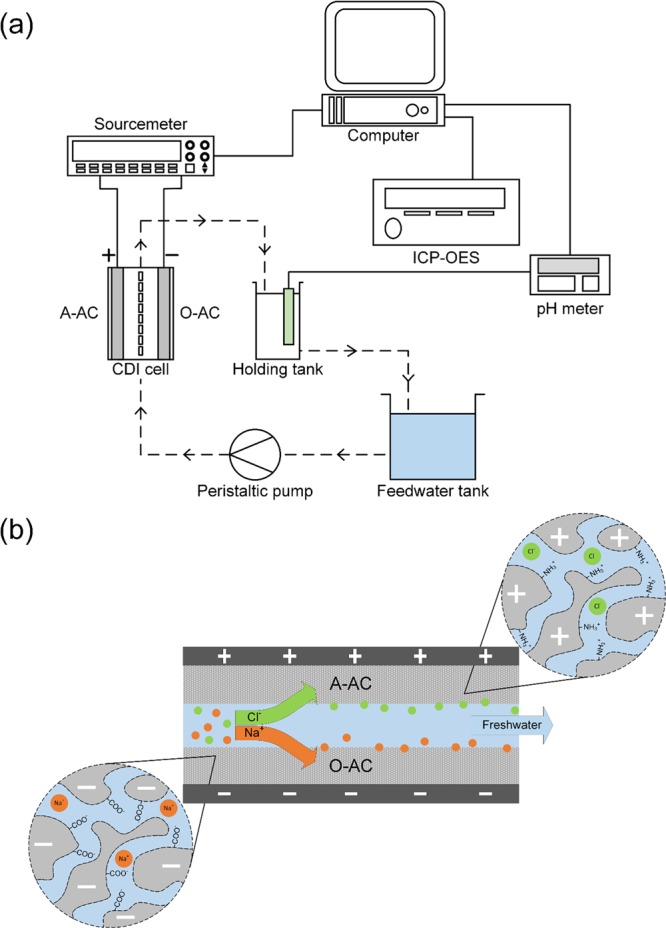
(a) Schematic of the CDI cell operating in the single-pass mode. Dotted lines indicate the path travelled by the water, whereas solid lines mark electrical connections. Note that aliquots were taken from the holding tank for ICP analysis. (b) Ion adsorption using functionalized AC materials.
We perform two sets of experiments: one using solutions containing a single type of salt and the second using solutions containing a mixture of salts. In single-salt experiments, we determine the cation adsorption capacity at saturation to define the upper limit of adsorption. Competition between ions of different charges or sizes will likely decrease the adsorption of any ion, and a measure of this decrease is useful in understanding how adsorption in multi-salt solution works. Five liters of 2.5, 5, or 10 mM stock solution was prepared for single-salt experiments, while salt mixtures used for multi-salt experiments were varied between 5 and 10 mM as described in Table 2. The amount of cation removed was determined by taking 1.5 mL aliquots of effluent solution from the holding tank and diluted 10 times for inductively coupled plasma optical emission spectroscopy (ICP-OES) analysis. The ICP spectrometer (ICPE-9820, Shimadzu) was operated in the radial view mode, and a four-point calibration curve was obtained before sample analysis. We assumed complete dissociation of ionic salt in water and that individual ions existed in stoichiometric amounts as specified by their chemical formula. Thus, 1 mol of monovalent salt such as NaCl dissociates into 1 mol of Na+ and Cl–. We next assumed that cations were only adsorbed by the cathode and anions were only adsorbed by the anode. Based on these assumptions, we derived a metric that measured the cation adsorption capacity of the cathode independent of the overall system. Cation adsorption capacity, Γcation (mmol g–1), is calculated as
| 2 |
where v is the flow rate (L min–1), c is the cation concentration of the effluent stream (mg L–1), Mcation is the molar mass of the cation (g mol–1), t is the time of aliquot extraction (min), and mcathode is the mass of the cathode (g).We also used a normalized charge efficiency to accommodate for the difference in charge required for the adsorption of a monovalent salt versus a divalent salt. Normalized charge efficiency, Λn, is calculated as
| 3 |
where z is the valence of the salt, Σ is the charge stored during the adsorption curve (C), and F is the Faraday’s constant of 96,485 (C mol–1). We note that charge efficiency is only calculated for single-salt experiments.
Table 2. Description of Multi-Salt Adsorption Experiments.
| multi-salt experiments |
|||
|---|---|---|---|
| variable | experiment no. | cation 1 | cation 2 |
| ionic mass | 1 | 5 mM Na+ | 5 mM K+ |
| 2 | 5 mM Mg2+ | 5 mM Ca2+ | |
| ionic charge | 3 | 5 mM Na+ | 5 mM Mg2+ |
| 4 | 5 mM K+ | 5 mM Ca2+ | |
| concentration | 5 | 10 mM Na+ | 5 mM Mg2+ |
| 6 | 10 mM K+ | 5 mM Ca2+ | |
3. Results and Discussion
3.1. Physical and Chemical Characterization
The morphology and elemental distribution of our AC samples are given in Figure S1. SEM images show a collection of fragmented carbon particles decorated with elemental oxygen. Additionally, we observe the presence of nitrogen in A-AC arising from amine functional groups. (Figure S1j). The porosity of AC was investigated, and the results are shown in Figure S2. Isotherms presented in Figure S2a are predominantly type I with a small hysteresis loop. These results are typical of AC and suggest a microporous material with some mesoporous characteristics. Untreated AC possessed the highest SSA at 1862 m2 g–1, while O-AC and A-AC were 1503 and 1768 m2 g–1, respectively (Table S2). The lower SSA of O-AC is likely due to extensive oxidation occurring at micropore sites, which caused micropores to coalesce into meso- or macropores.47Figure S2b–d shows similar porosity profiles for AC, O-AC, and A-AC. Pore size distributions (red curves) showed a primary peak at ∼1.54 nm with a minor mesoporous peak at 3.39 nm.
In Figure 2, the FTIR spectra of AC and O-AC were remarkably similar with an O–H stretch centered around 3430 cm–1, two types of C=C stretch at ∼1630 cm–1 (alkenyl) and ∼1560 cm–1 (aromatic), an alkane C–H bend at ∼1380 cm–1, and C–O–C stretch at 1114 cm–1 for AC and 1131 cm–1 for O-AC.48 On the other hand, the FTIR spectrum of A-AC showed a comparatively more intense peak at 3433 cm–1, which could be interpreted as a combination of both hydroxyl O–H stretch and N–H stretch.41,42 Peaks belonging to N–H bend (1636 cm–1), aliphatic C–N stretch (1384 cm–1), and aromatic C–N stretch (1096 cm–1) were also observed, thus confirming the presence of amine functional groups.
Figure 2.
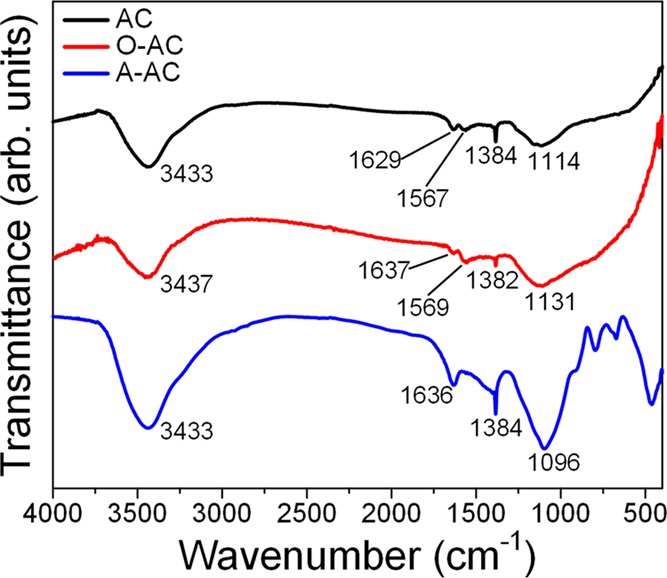
FTIR spectra of AC, O-AC, and A-AC.
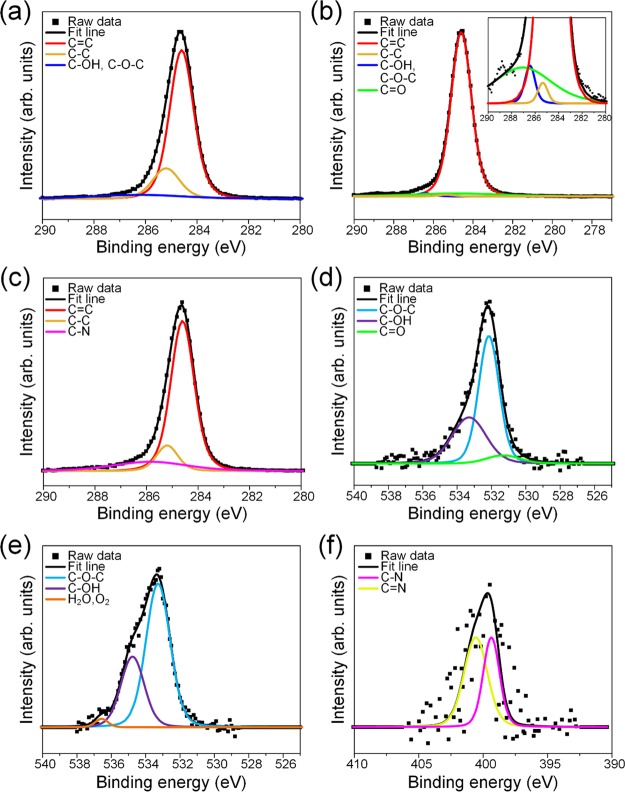
XPS results are provided in Figure 3. The C 1s spectrum of untreated AC (Figure 3a) could be deconvoluted into three peaks: two main peaks corresponding to graphitic C=C (284.6 eV) and alkyl C–C (285.2 eV) and a minor peak belonging to carbon singly bonded to oxygen (C–OH and/or C–O–C at 286.3 eV). O-AC showed a similar spectra profile save for the appearance of carbonyl carbon, C=O at 287 eV. We also observed a notable decrease in the peak area of the alkyl C–C group (17.5 to 0.73 at %), which implied an oxidation pathway involving an attack on sp3 hybridized carbon bonds. This seems likely when we consider the subsequent increase in oxygen moieties (Figure 3b, inset) after oxidation. The peak area of graphitic C=C was also comparatively higher, which indicated a defect-free structure, which was only mildly oxidized. In contrast, A-AC did not show any oxygen functionalities but showed an amine C–N peak at 285.8 eV. The atomic percent concentrations of peaks in the C 1s spectrum are provided in Table S1.
Figure 3.
C 1s XPS spectra for (a) AC, (b) O-AC, and (c) A-AC. O 1s XPS spectra for (d) AC and (e) O-AC. N 1s XPS spectra for (f) A-AC. (Inset in (b) is a magnified image of C 1s peaks from 280 to 290 eV.)
The O 1s spectrum is compared between untreated AC and O-AC in Figure 2d,e, respectively. Consistent with C 1s results, the O 1s spectrum of AC could be deconvoluted into ketonic C=O (531.3 eV), ether C–O–C (532.2 eV), and hydroxyl C–OH (533.3 eV) peaks. Similarly, O 1s of O-AC comprised of C–O–C (532.1 eV) and C–OH (533.6 eV) peaks with an additional peak at 535.4 eV attributed to chemisorbed water or oxygen molecules as suggested by the literature.48−50 As for A-AC, its N 1s spectrum was composed of two peaks: amine C–N (399.4 eV) and nitrogen species in C–N (400.6 eV) configurations.
3.2. Single-Salt Solution Experiments
A preliminary benchmarking of our system in various salt solutions was first performed before moving on to multi-salt solutions. Figure S4 shows the results of ICP analyses conducted in single-salt solutions using either AC (top row) or O-AC (bottom row) as the cathode. The results presented here were obtained during the third cycle of adsorption and normalized to initial concentration to account for differences in cation mass. Although the potential was applied for a full 15 min, much of the ion removal occurred during the first 2.5 min or so. Since the single-pass mode was used, effluent solution will return to stock concentration once electrodes are saturated with ions, and ion adsorption becomes minimal. Closer inspection of the concentration curves revealed slight differences in the rate of adsorption and/or desorption between monovalent and divalent cations. Sharper adsorption and desorption curves were observed for experiments involving monovalent cations due to faster diffusion kinetics in solution resulting from their smaller hydrated radii (see Table 1).
Table 1. Summary of Ion Properties29,32,65.
| ion | valence | ionic mass (amu) | hydrated radius (Å) | hydration energy (kJ mol–1) |
|---|---|---|---|---|
| Na | +1 | 22.99 | 3.58 | –365 |
| K | +1 | 39.098 | 3.31 | –295 |
| Mg | +2 | 24.305 | 4.28 | –1830 |
| Ca | +2 | 40.078 | 4.12 | –1505 |
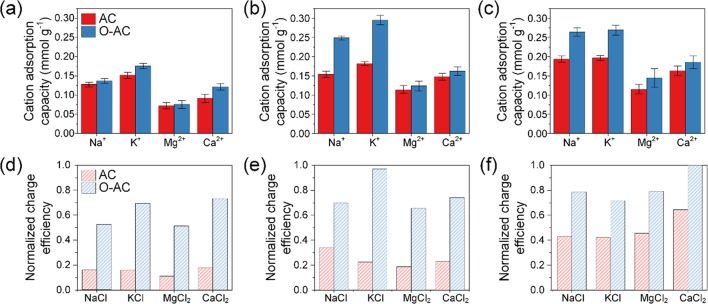
A summary of cation adsorption capacities is provided in Figure 4a–c, and it is apparent that adsorption capacities follow a decreasing order of K+ > Na+ > Ca2+ > Mg2+ regardless of whether the cathode used was AC or O-AC. This order also corresponds to the order at which hydrated radius and energy decrease (see Table 1), which is consistent with what had been reported.29,32,34 In comparing the hydrated cation size with the pore size, we note that Na+ and K+ possessed hydrated diameters approximately half the main pore size of 1.54 nm. Thus, either two Na+ or two K+ ions could have occupied a pore without shedding their hydrated shells. We further note that the presence of charged groups within narrow pores could cause reorientation of hydration shells51,52 and/or dehydration effects,53,54 which could result in higher than expected ion adsorption. O-AC showed greater cation adsorption as compared to plain AC, which was remarkable considering its lower surface area. This enhanced cation adsorption could be attributed to an increased electrostatic attraction between oxygen moieties on O-AC and cations. Furthermore, oxygen moieties can also function as an ion-exchange layer 40–42,61 to reject anions and improve charge efficiency. Indeed, we observe higher salt adsorption capacities and charge efficiencies of O-AC across all salt solutions (Figure 4d–f). Charge efficiencies do not seem to follow any order corresponding to ion properties but generally increase at higher salt concentrations.
Figure 4.
Cation adsorption capacities in (a) 2.5 mM, (b) 5 mM, and (c) 10 mM single-salt solution experiments. Salt adsorption capacities (solid blue and red columns) and normalized charge efficiencies (shaded blue and red columns) of (d) 2.5 mM, (e) 5 mM, and (f) 10 mM single-salt solution experiments.
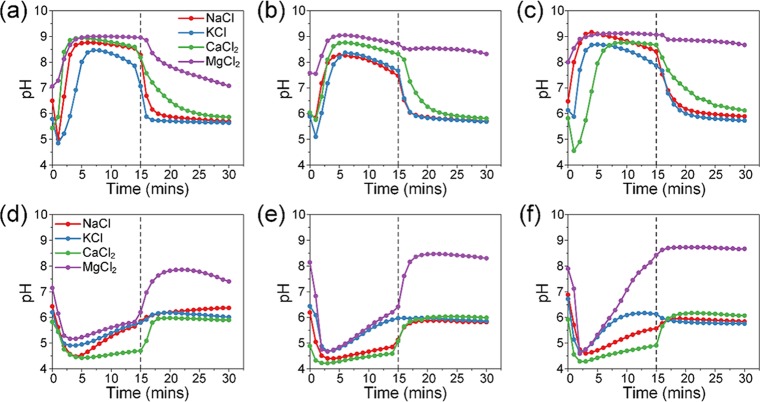
The initial pH value of the salt solutions was recorded prior to CDI experiments as a reference. pH values of NaCl, KCl, and CaCl2 solutions were slightly lower than the expected neutral value of 7, which was probably due to the presence of dissolved CO2. The pH value of MgCl2 solution was approximately 6 when MgCl2 first dissolved but steadily increased to 8–9. MgCl2 solution was originally a neutral to mildly acidic salt under room temperature conditions, and the increase in pH was likely due to the formation of small amounts of MgCO3. When a potential of 1.0 V was applied, the AC (Figure 5a–c) cathode system showed an increase in pH, whereas O-AC (Figure 5d–f) showed a decrease in pH. We note that the increase in pH for the AC cathode system was not immediate for some solutions, and a small dip in pH was sometimes observed. This dip could be the result of transient faradaic reactions due to a large potential swing from 0 to 1.0 V. After that, pH values rapidly increased and seem to stabilize at values between 8 and 9. Previous reports30,55,56 attribute this pH change to oxygen reduction reactions (ORRs) occurring at the carbon cathode. ORRs can proceed via a two-electron or four-electron pathway,30,57 and both pathways will inevitably produce hydroxyl ions, causing the pH to increase. However, this pH was not completely constant and tapered off after the 7.5 min mark. Since the applied potential was low (<1.23 V), we can rule out Cl– oxidation57 and/or water splitting34 as reasons for the decrease. This decrease in pH was likely due to unsustained rates of the reaction from ORRs. As rates of the reaction decreased, the effluent pH gradually returned to its initial value. Furthermore, we did not observe any salt precipitation during our experiments despite the high pH. Upon removal of the potential, effluent pH returned to their original pH values.
Figure 5.
Effluent pH of (a) 2.5 mM, (b) 5 mM, and (c) 10 mM single-salt solution experiments using AC as the cathode. Effluent pH of (d) 2.5 mM, (e) 5 mM, and (f) 10 mM single-salt solution experiments using O-AC as the cathode (dotted line at a 15 min mark indicates a switch from adsorption to desorption).
In contrast, O-AC showed an almost inverted pH profile. pH values first decreased to values as low as 4.25 before steadily climbing up. The decrease in pH could be attributed to an ion exchange between protons attached to negatively charged oxygen moieties and cations. As such, protons are substituted for cations and are displaced into the water, causing the decrease in pH. As cation adsorption starts to saturate, the rate of displacement of protons will also decrease, which will result in the pH returning to its initial level. Once the potential is removed, the effluent pH rapidly returns to its initial pH. Thus, a negatively charged cathode can effectively adsorb cations and reduce the effluent pH at the same time, which makes it an attractive candidate for water softening.
3.3. Multi-Salt Solution Experiments
All experiments in this section involved the use of a solution mixed with two kinds of salts. Experiments were designed to investigate one of the three factors: (1) ionic mass, (2) ionic charge, or (3) concentration. A description of the experiments is provided in Table 2.
3.3.1. Effects of Ionic Mass
The influence of cation mass was investigated in experiments 1 and 2 (see Table 2) where cations were either all monovalent or all divalent. Cation adsorption curves presented in Figure S5 show similar behavior to that of single-salt solution experiments. Adsorption and desorption curves using the O-AC cathode were distinctly sharper than that of AC and can be attributed to the stronger electrostatic forces provided by the O-AC surface. One might expect to see slight differences in rates of adsorption due to ion competition, but the curves showed an almost simultaneous drop in concentration at around 2 min. Thus, it appeared that there was no kinetic or diffusion constraints related to ionic mass.
Adsorption capacities are calculated and summarized in Figure 6a,b. In experiment 1 (Figure 6a), we observed higher adsorption capacities for K+ than Na+ regardless of whether the cathode used was AC or O-AC. If we were to assume cation adsorption on both sides of a pore, two Na+ ions possessed a combined diameter of 1.43 nm, which is slightly smaller than the main pore size of 1.54 nm. In contrast, the combined diameter of two K+ ions was only 1.32 nm. Given that the hydration energy of K+ was smaller than Na+, it was energetically more favorable for two K+ ions to fit in a pore rather than two Na+ ions. Single-salt experiments did not face this problem since there was no competition between cations. It should be noted that the component ion adsorption capacities in experiment 1 were far lower than those in single-salt experiments. For example, the total adsorption capacity of Na+ and K+ components in multi-salt solution using an AC cathode was 0.122 mmol g–1 as compared to the adsorption capacity of either Na+ (0.154 mmol g–1) or K+ (0.182 mmol g–1) in single-salt experiments. Competition between dissimilar ions for limited adsorption sites had resulted in a lower overall adsorption capacity.
Figure 6.
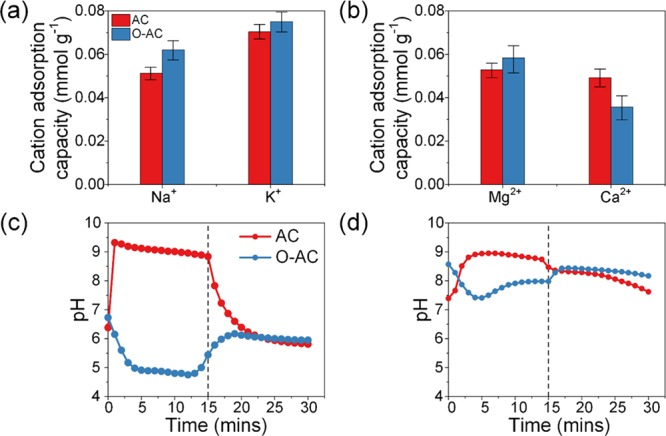
Cation adsorption capacities in multi-salt solutions containing (a) 5 mM NaCl and 5 mM KCl and (b) 5 mM MgCl2 and 5 mM CaCl2 solutions. Effluent pH of (c) 5 mM NaCl and 5 mM KCl and (d) 5 mM MgCl2 and 5 mM CaCl2 solutions.
As for divalent cation adsorption, we observed a higher adsorption capacity for Mg2+ than Ca2+ for both AC and O-AC cathodes. Mg2+ adsorption with an AC cathode amounted to 52% of total cation adsorption, whereas it was 62% with an O-AC cathode. According to hydrolysis constant values provided by He et al.,58 the pKa of Mg2+ (11.4) is lower than Ca2+ (12.8), which indicated a higher tendency to hydrolyze. Hydrolysis effects could be significant in experiments using the unmodified AC cathode since adsorption occurred under alkaline conditions. However, our results did not reflect the effects of cation hydrolysis as Mg2+ adsorption was comparable to Ca2+ after accounting for experimental deviation. In the case of divalent cation adsorption, electrostatic attractive forces were higher across mesopores, which resulted in faster diffusion kinetics for the cation with a smaller mass. Therefore, Mg2+ experienced a higher rate of mass transfer than Ca2+. Once adsorbed onto the carbon surface, Mg2+ ions were not easily displaced by Ca2+ ions due to similarly high electrostatic forces acting on them. In this case, O-AC showed greater selectivity toward Mg2+ than Ca2+.
Effluent pH curves in Figure 6c,d resemble those in Figure 5b,e, respectively. During adsorption, pH increased for the AC cathode and decreased for the O-AC cathode. The pH curve of O-AC cathode did not decrease as much as one might expect, given the results in single-salt experiments. Nevertheless, it is still an improvement over its AC counterpart.
3.3.2. Effects of Ionic Charge
The effects of charge were investigated in salt solutions containing equimolar concentrations of Na+ and Mg2+ or K+ and Ca2+ (experiments 3 and 4, respectively). Monovalent and divalent cations were paired this way to minimize the effects of cation mass. Under typical conditions, electrosorption using an AC cathode resulted in a concentration curve with sharper adsorption and desorption peaks for monovalent cations due to better diffusion kinetics. Divalent cations tend to adsorb much slower due to their larger sizes. Although this was observed for the O-AC cathode system (Figure S6b,d), the concentration curves of monovalent cations appeared unstable and less symmetrical. The adsorption of divalent cations was also visibly slower and took a longer time to reach saturation. The discrepancy in saturation times between divalent cation adsorption for the O-AC cathode system and the AC cathode system was unmistakable. We hypothesize that the substantially lower hydration energies of monovalent cations endowed them with greater affinity for the charged carbon surface, and these ions59 had first adsorbed onto the pore surfaces of O-AC around the 2 min mark, which deprived divalent cations of adsorption sites. However, strong electrostatic forces between divalent cations and the O-AC surface eventually led to divalent ions displacing their monovalent competitors around the 2.5 min mark. Mg2+ and Ca2+ adsorption accounted for 52 and 49% of total cation adsorption in an AC cathode system, whereas it was 68 and 69% for the O-AC cathode system (Figure 7a,b), respectively. Since the hydration energy of Ca2+ is lower than that of Mg2+, the marginally higher adsorption of Ca2+ over Mg2+ could be due to partial reorientation or dehydration of the hydration shell near the charged carbon pores.59 Thus, simple oxidation of the carbon surface can increase selectivity of divalent over monovalent cations. Effluent pH curves shown in Figure 7c,d were expectedly a mix between the pH of monovalent and divalent salt solutions. Changes in effluent pH during CDI mostly followed previous experiments.
Figure 7.
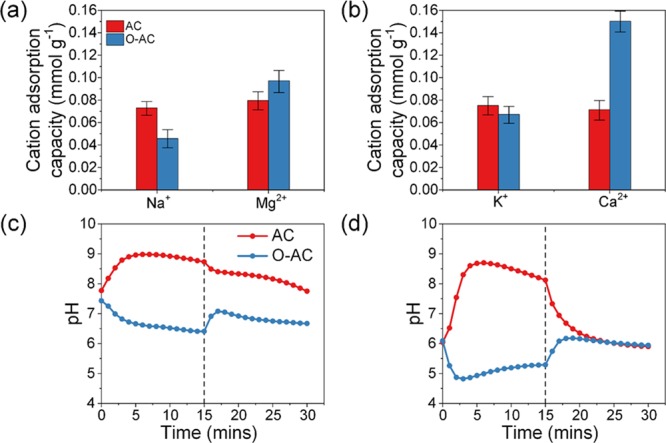
Cation adsorption capacities in multi-salt solutions containing (a) 5 mM NaCl and 5 mM MgCl2 and (b) 5 mM KCl and 5 mM CaCl2 solutions. Effluent pH of (c) 5 mM NaCl and 5 mM MgCl2 and (d) 5 mM KCl and 5 mM CaCl2 solutions.
3.3.3. Effects of Concentration
We investigated the effects of concentration in solutions containing 10 mM monovalent salt and 5 mM divalent salt (experiments 5 and 6, respectively). Cation combinations were chosen to be the same as experiments 3 and 4. Salt concentration is a variable that is rarely considered in reports on selective removal of ions yet plays an influential role in the competitive removal of dissimilar ion species. The concentration of monovalent cations was chosen to be twice that of divalent cations to simulate an environment of equal ionic strength. Figure S7 shows the results of our electrosorption experiments. Two observations could be made based on the results of the AC cathode system in Figure S7a,c. First, there was an overall increase in adsorption of both monovalent and divalent cations as compared to experiments 3 and 4. Second, adsorption peaks for Mg2+ and Ca2+ had shifted slightly to the right, which implied the displacement of some monovalent cations. The O-AC cathode system, on the other hand, retained similar adsorption/desorption patterns as before.
Cation adsorption capacities are calculated and described in Figure 8a,b. As compared to experiments 3 and 4, the AC cathode showed a higher proportion of Na+ and K+ adsorption capacities with Na+ and K+ accounting for 65.0 and 67.4% of total cation adsorption capacity, respectively. These results can be attributed to the higher concentration and ionic strength of monovalent cations. Divalent cation selectivity was evaluated using the O-AC cathode in experiments 5 and 6, and O-AC showed a loss of selectivity for Mg2+ over Na+ but not for Ca2+ over K+. It should be noted that a loss of selectivity does not imply a decrease of Mg2+ adsorption capacity as observed in Figure 6b, Figure 7a, and Figure 8a where the adsorption capacity had remained fairly constant at around 0.10 mmol g–1. The only time a decrease was recorded was when Mg2+ was competing with Ca2+ ions (Figure 6b). Thus, this simply meant that a greater amount of Na+ was adsorbed.
Figure 8.
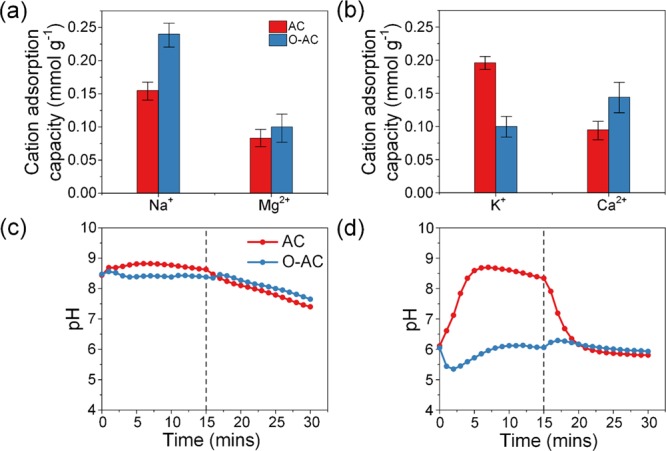
Cation adsorption capacities in multi-salt solutions containing (a) 10 mM NaCl and 5 mM MgCl2 and (b) 10 mM KCl and 5 mM CaCl2 solutions. Effluent pH of (c) 10 mM NaCl and 5 mM MgCl2 and (d) 10 mM KCl and 5 mM CaCl2 solutions.
Effluent pH of both AC and O-AC cathodes in experiment 5 (Figure 8c) averaged around 8.5 during adsorption and gradually decreased during desorption. It appeared that an increase in Na+ concentration or rather an increase in ionic strength of solution had minimized the effects of ion-exchange reactions and stabilized the pH at basic levels. Once the potential was removed, pH slowly returned to a pH dominated by the presence of NaCl. Experiment 6 (Figure 8d) shows a familiar trend of pH increase for the AC cathode and a pH decrease for the O-AC cathode. Effluent pH of O-AC decreased first but recovered rather quickly due to the high concentration of KCl.
4. Conclusions
We have investigated the adsorption of monovalent and divalent cations using functionalized carbon electrodes in a series of single- and multi-salt experiments using NaCl, KCl, MgCl2, and CaCl2. We first started our experiments in single-salt solutions to determine a baseline performance for our functionalized materials then proceeded to investigate the cation adsorption of O-AC over the AC cathode. We recorded an increase in adsorption capacities corresponding to the order at which hydrated cation radius decreases. This was reasonable given that smaller ions fit more easily in pores. Ion exchange occurring on the functionalized surface of O-AC provided an additional advantage of decreasing pH, which was desirable for water softening.
Competition between cations was investigated in multi-salt solution experiments based on (1) ionic mass, (2) ionic charge, or (3) concentration. First, we showed how kinetic advantages of a smaller ionic mass contributed to an increase in Mg2+ adsorption over Ca2+ for the O-AC cathode. Next, we demonstrated how divalent cation selectivity could be achieved using an oxidized AC. The divalent cation selectivity was attributed to a greater electrostatic attraction between negatively charged oxygen moieties and divalent cations. Lastly, we report a loss of selectivity for Mg2+ over Na+ when the ionic strength of Na+ was matched to Mg2+. Future work will have to investigate the limits of ion selectivity against a background of ions with matching or even higher ionic strength.
Acknowledgments
The research project was supported by the Singapore National Research Foundation under its Environmental & Water Technologies Strategic Research Programme and administered by the Environment & Water Industry Programme Office (EWI) of the PUB. SUTD CGH collaboration research grant T1HITF1803 is gratefully acknowledged.
Supporting Information Available
The Supporting Information is available free of charge at https://pubs.acs.org/doi/10.1021/acsomega.9b02330.
Material characterization for the AC and O-AC samples, SEM image comparison, EDS spectrum comparison, BET results with different pore sizes and surface areas, the results of CV experiments and cation adsorptions, and detailed experimental descriptions(PDF)
The authors declare no competing financial interest.
Supplementary Material
References
- Urairi M.; Tsuru T.; Nakao S.-i.; Kimura S. Bipolar reverse osmosis membrane for separating mono-and divalent ions. J. Membr. Sci. 1992, 70, 153–162. 10.1016/0376-7388(92)80102-P. [DOI] [Google Scholar]
- Park M.; Park J.; Lee E.; Khim J.; Cho J. Application of nanofiltration pretreatment to remove divalent ions for economical seawater reverse osmosis desalination. Desalin. Water Treat. 2016, 57, 20661–20670. 10.1080/19443994.2015.1111807. [DOI] [Google Scholar]
- Lee S.; Lee C.-H. Effect of operating conditions on CaSO4 scale formation mechanism in nanofiltration for water softening. Water Res. 2000, 34, 3854–3866. 10.1016/S0043-1354(00)00142-1. [DOI] [Google Scholar]
- Galama A. H.; Daubaras G.; Burheim O. S.; Rijnaarts H. H. M.; Post J. W. Seawater electrodialysis with preferential removal of divalent ions. J. Membr. Sci. 2014, 452, 219–228. 10.1016/j.memsci.2013.10.050. [DOI] [Google Scholar]
- Lee H.-J.; Song J.-H.; Moon S.-H. Comparison of electrodialysis reversal (EDR) and electrodeionization reversal (EDIR) for water softening. Desalination 2013, 314, 43–49. 10.1016/j.desal.2012.12.028. [DOI] [Google Scholar]
- Barakat M. A. New trends in removing heavy metals from industrial wastewater. Arabian J. Chem. 2011, 4, 361–377. 10.1016/j.arabjc.2010.07.019. [DOI] [Google Scholar]
- Entezari M. H.; Tahmasbi M. Water softening by combination of ultrasound and ion exchange. Ultrason. Sonochem. 2009, 16, 356–360. 10.1016/j.ultsonch.2008.09.008. [DOI] [PubMed] [Google Scholar]
- Hemmatifar A.; Palko J. W.; Stadermann M.; Santiago J. G. Energy breakdown in capacitive deionization. Water Res. 2016, 104, 303–311. 10.1016/j.watres.2016.08.020. [DOI] [PubMed] [Google Scholar]
- Epsztein R.; Shaulsky E.; Qin M.; Elimelech M. Activation behavior for ion permeation in ion-exchange membranes: Role of ion dehydration in selective transport. J. Membr. Sci. 2019, 580, 316–326. 10.1016/j.memsci.2019.02.009. [DOI] [Google Scholar]
- Mossad M.; Zhang W.; Zou L. Using capacitive deionisation for inland brackish groundwater desalination in a remote location. Desalination 2013, 308, 154–160. 10.1016/j.desal.2012.05.021. [DOI] [Google Scholar]
- Huang Z.; Lu L.; Cai Z.; Ren Z. J. Individual and competitive removal of heavy metals using capacitive deionization. J. Hazard. Mater. 2016, 302, 323–331. 10.1016/j.jhazmat.2015.09.064. [DOI] [PubMed] [Google Scholar]
- Lado J. J.; Pérez-Roa R. E.; Wouters J. J.; Tejedor-Tejedor M. I.; Federspill C.; Ortiz J. M.; Anderson M. A. Removal of nitrate by asymmetric capacitive deionization. Sep. Purif. Technol. 2017, 183, 145–152. 10.1016/j.seppur.2017.03.071. [DOI] [Google Scholar]
- Kim Y.-J.; Choi J.-H. Selective removal of nitrate ion using a novel composite carbon electrode in capacitive deionization. Water Res. 2012, 46, 6033–6039. 10.1016/j.watres.2012.08.031. [DOI] [PubMed] [Google Scholar]
- Tang W.; He D.; Zhang C.; Kovalsky P.; Waite T. D. Comparison of Faradaic reactions in capacitive deionization (CDI) and membrane capacitive deionization (MCDI) water treatment processes. Water Res. 2017, 120, 229–237. 10.1016/j.watres.2017.05.009. [DOI] [PubMed] [Google Scholar]
- Qin M.; Deshmukh A.; Epsztein R.; Patel S. K.; Owoseni O.M.; Walker W. S.; Elimelech M. Comparison of energy consumption in desalination by capacitive deionization and reverse osmosis. Desalination 2019, 455, 100–114. 10.1016/j.desal.2019.01.003. [DOI] [Google Scholar]
- Qu Y.; Campbell P. G.; Gu L.; Knipe J. M.; Dzenitis E.; Santiago J. G.; Stadermann M. Energy consumption analysis of constant voltage and constant current operations in capacitive deionization. Desalination 2016, 400, 18–24. 10.1016/j.desal.2016.09.014. [DOI] [Google Scholar]
- Huang G.-H.; Chen T.-C.; Hsu S.-F.; Huang Y.-H.; Chuang S.-H. Capacitive deionization (CDI) for removal of phosphate from aqueous solution. Desalin. Water Treat. 2014, 52, 759–765. 10.1080/19443994.2013.826331. [DOI] [Google Scholar]
- Huang X.; He D.; Tang W.; Kovalsky P.; Waite T.D. Investigation of pH-dependent phosphate removal from wastewaters by membrane capacitive deionization (MCDI). Environ. Sci.: Water Res. Technol. 2017, 3, 875–882. 10.1039/C7EW00138J. [DOI] [Google Scholar]
- Zuo K.; Kim J.; Jain A.; Wang T.; Verduzco R.; Long M.; Li Q. Novel composite electrodes for selective removal of sulfate by the capacitive deionization process. Environ. Sci. Technol. 2018, 52, 9486–9494. 10.1021/acs.est.8b01868. [DOI] [PubMed] [Google Scholar]
- Zafra M. C.; Lavela P.; Macías C.; Rasines G.; Tirado J. L. Electrosorption of environmental concerning anions on a highly porous carbon aerogel. J. Electroanal. Chem. 2013, 708, 80–86. 10.1016/j.jelechem.2013.09.020. [DOI] [Google Scholar]
- Yeo J.-H.; Choi J.-H. Enhancement of nitrate removal from a solution of mixed nitrate, chloride and sulfate ions using a nitrate-selective carbon electrode. Desalination 2013, 320, 10–16. 10.1016/j.desal.2013.04.013. [DOI] [Google Scholar]
- Peng L.; Chen Y.; Dong H.; Zeng Q.; Song H.; Chai L.; Gu J.-D. Removal of trace As (V) from water with the titanium dioxide/ACF composite electrode. Water, Air, Soil Pollut. 2015, 226, 203. 10.1007/s11270-015-2463-x. [DOI] [Google Scholar]
- Fan C.-S.; Tseng S.-C.; Li K.-C.; Hou C.-H. Electro-removal of arsenic (III) and arsenic (V) from aqueous solutions by capacitive deionization. J. Hazard. Mater. 2016, 312, 208–215. 10.1016/j.jhazmat.2016.03.055. [DOI] [PubMed] [Google Scholar]
- Chen Y.; Peng L.; Zeng Q.; Yang Y.; Lei M.; Song H.; Chai L.; Gu J. Removal of trace Cd (II) from water with the manganese oxides/ACF composite electrode. Clean Technol. Environ. Policy 2015, 17, 49–57. 10.1007/s10098-014-0756-1. [DOI] [Google Scholar]
- Gu X.; Yang Y.; Hu Y.; Hu M.; Wang C. Fabrication of graphene-based xerogels for removal of heavy metal ions and capacitive deionization. ACS Sustainable Chem. Eng. 2015, 3, 1056–1065. 10.1021/acssuschemeng.5b00193. [DOI] [Google Scholar]
- Wei Y.; Xu L.; Yang K.; Wang Y.; Wang Z.; Kong Y.; Xue H. Electrosorption of toxic heavy metal ions by mono S-or N-doped and S, N-codoped 3D graphene aerogels. J. Electrochem. Soc. 2017, 164, E17–E22. 10.1149/2.1301702jes. [DOI] [Google Scholar]
- Gabelich C. J.; Tran T. D.; Suffet I. H. M. Electrosorption of inorganic salts from aqueous solution using carbon aerogels. Environ. Sci. Technol. 2002, 36, 3010–3019. 10.1021/es0112745. [DOI] [PubMed] [Google Scholar]
- Chen Z.; Zhang H.; Wu C.; Wang Y.; Li W. A study of electrosorption selectivity of anions by activated carbon electrodes in capacitive deionization. Desalination 2015, 369, 46–50. 10.1016/j.desal.2015.04.022. [DOI] [Google Scholar]
- Seo S.-J.; Jeon H.; Lee J. K.; Kim G.-Y.; Park D.; Nojima H.; Lee J.; Moon S.-H. Investigation on removal of hardness ions by capacitive deionization (CDI) for water softening applications. Water Res. 2010, 44, 2267–2275. 10.1016/j.watres.2009.10.020. [DOI] [PubMed] [Google Scholar]
- Hou C. H.; Huang C. Y. A comparative study of electrosorption selectivity of ions by activated carbon electrodes in capacitive deionization. Desalination 2013, 314, 124–129. 10.1016/j.desal.2012.12.029. [DOI] [Google Scholar]
- Han L.; Karthikeyan K. G.; Anderson M. A.; Gregory K. B. Exploring the impact of pore size distribution on the performance of carbon electrodes for capacitive deionization. J. Colloid Interface Sci. 2014, 430, 93–99. 10.1016/j.jcis.2014.05.015. [DOI] [PubMed] [Google Scholar]
- Hassanvand A.; Chen G. Q.; Webley P. A.; Kentish S. E. A comparison of multicomponent electrosorption in capacitive deionization and membrane capacitive deionization. Water Res. 2018, 131, 100–109. 10.1016/j.watres.2017.12.015. [DOI] [PubMed] [Google Scholar]
- Choi J.; Lee H.; Hong S. Capacitive deionization (CDI) integrated with monovalent cation selective membrane for producing divalent cation-rich solution. Desalination 2016, 400, 38–46. 10.1016/j.desal.2016.09.016. [DOI] [Google Scholar]
- Nie C.; Zhan Y.; Pan L.; Li H.; Sun Z. Electrosorption of different cations and anions with membrane capacitive deionization based on carbon nanotube/nanofiber electrodes and ion-exchange membranes. Desalin. Water Treat. 2012, 30, 266–271. 10.5004/dwt.2011.2089. [DOI] [Google Scholar]
- Mao S.; Chen L.; Zhang Y.; Li Z.; Ni Z.; Sun Z.; Zhao R. Fractionation of mono-and divalent ions by capacitive deionization with nanofiltration membrane. J. Colloid Interface Sci. 2019, 544, 321–328. 10.1016/j.jcis.2019.02.093. [DOI] [PubMed] [Google Scholar]
- Yan T.; Xu B.; Zhang J.; Shi L.; Zhang D. Ion-selective asymmetric carbon electrodes for enhanced capacitive deionization. RSC Adv. 2018, 8, 2490–2497. 10.1039/C7RA10443J. [DOI] [PMC free article] [PubMed] [Google Scholar]
- Yang J.; Zou L.; Choudhury N.R. Ion-selective carbon nanotube electrodes in capacitive deionisation. Electrochim. Acta 2013, 91, 11–19. 10.1016/j.electacta.2012.12.089. [DOI] [Google Scholar]
- Liu P.; Wang H.; Yan T.; Zhang J.; Shi L.; Zhang D. Grafting sulfonic and amine functional groups on 3D graphene for improved capacitive deionization. J. Mater. Chem. A 2016, 4, 5303–5313. 10.1039/C5TA10680J. [DOI] [Google Scholar]
- Chen C.; Huang W. Aggregation kinetics of diesel soot nanoparticles in wet environments. Environ. Sci. Technol. 2017, 51, 2077–2086. 10.1021/acs.est.6b04575. [DOI] [PubMed] [Google Scholar]
- Flores S. C.; Kherb J.; Konelick N.; Chen X.; Cremer P. S. The effects of Hofmeister cations at negatively charged hydrophilic surfaces. J. Phys. Chem. C 2012, 116, 5730–5734. 10.1021/jp210791j. [DOI] [Google Scholar]
- Ruiz-Cabello F. J. M.; Trefalt G.; Csendes Z.; Sinha P.; Oncsik T.; Szilagyi I.; Maroni P.; Borkovec M. Predicting aggregation rates of colloidal particles from direct force measurements. J. Phys. Chem. B 2013, 117, 11853–11862. 10.1021/jp406061f. [DOI] [PubMed] [Google Scholar]
- Oncsik T.; Trefalt G.; Csendes Z.; Szilagyi I.; Borkovec M. Aggregation of negatively charged colloidal particles in the presence of multivalent cations. Langmuir 2014, 30, 733–741. 10.1021/la4046644. [DOI] [PubMed] [Google Scholar]
- Oyarzun D. I.; Hemmatifar A.; Palko J. W.; Stadermann M.; Santiago J. G. Ion selectivity in capacitive deionization with functionalized electrode: Theory and experimental validation. Water Res. X 2018, 1, 100008. 10.1016/j.wroa.2018.100008. [DOI] [PMC free article] [PubMed] [Google Scholar]
- Leong Z. Y.; Lu G.; Yang H. Y. Three-dimensional graphene oxide and polyvinyl alcohol composites as structured activated carbons for capacitive desalination. Desalination 2019, 451, 172–181. 10.1016/j.desal.2017.07.018. [DOI] [Google Scholar]
- Leong Z. Y.; Yang H. Y. Porous carbon hollow spheres synthesized via a modified Stöber method for capacitive deionization. RSC Adv. 2016, 6, 53542–53549. 10.1039/C6RA06489B. [DOI] [Google Scholar]
- Ahmed M. A.; Tewari S. Performance evaluation of asymmetric capacitive deionization with carbon aerogel based fiber-paper electrodes: Effect of gold deposition vs acid treatment. J. Electroanal. Chem. 2019, 835, 30–39. 10.1016/j.jelechem.2019.01.006. [DOI] [Google Scholar]
- Huang C.-C.; Li H.-S.; Chen C.-H. Effect of surface acidic oxides of activated carbon on adsorption of ammonia. J. Hazard. Mater. 2008, 159, 523–527. 10.1016/j.jhazmat.2008.02.051. [DOI] [PubMed] [Google Scholar]
- Desimoni E.; Casella G. I.; Morone A.; Salvi A. M. XPS determination of oxygen-containing functional groups on carbon-fibre surfaces and the cleaning of these surfaces. Surf. Interface Anal. 1990, 15, 627–634. 10.1002/sia.740151011. [DOI] [Google Scholar]
- Biniak S.; Szymański G.; Siedlewski J.; Świątkowski A. The characterization of activated carbons with oxygen and nitrogen surface groups. Carbon 1997, 35, 1799–1810. 10.1016/S0008-6223(97)00096-1. [DOI] [Google Scholar]
- Arrigo R.; Hävecker M.; Wrabetz S.; Blume R.; Lerch M.; McGregor J.; Parrott E. P. J.; Zeitler J. A.; Gladden L. F.; Knop-Gericke A.; Schlögl R.; Su D. S. Tuning the Acid/Base Properties of Nanocarbons by Functionalization via Amination. J. Am. Chem. Soc. 2010, 132, 9616–9630. 10.1021/ja910169v. [DOI] [PubMed] [Google Scholar]
- Zwolak M.; Wilson J.; Di Ventra M. Dehydration and ionic conductance quantization in nanopores. J. Phys.: Condens. Matter 2010, 22, 454126. 10.1088/0953-8984/22/45/454126. [DOI] [PMC free article] [PubMed] [Google Scholar]
- Tivony R.; Safran S.; Pincus P.; Silbert G.; Klein J. Charging dynamics of an individual nanopore. Nat. Commun. 2018, 9, 4203. 10.1038/s41467-018-06364-1. [DOI] [PMC free article] [PubMed] [Google Scholar]
- Chmiola J.; Yushin G.; Gogotsi Y.; Portet C.; Simon P.; Taberna P.-L. Anomalous increase in carbon capacitance at pore sizes less than 1 nanometer. Science 2006, 313, 1760–1763. 10.1126/science.1132195. [DOI] [PubMed] [Google Scholar]
- Richards L. A.; Schäfer A. I.; Richards B. S.; Corry B. The importance of dehydration in determining ion transport in narrow pores. Small 2012, 8, 1701–1709. 10.1002/smll.201102056. [DOI] [PubMed] [Google Scholar]
- Feng G.; Qiao R.; Huang J.; Sumpter B. G.; Meunier V. Ion Distribution in Electrified Micropores and Its Role in the Anomalous Enhancement of Capacitance. ACS Nano 2010, 4, 2382–2390. 10.1021/nn100126w. [DOI] [PubMed] [Google Scholar]
- Arulrajan A. C.; Ramasamy D. L.; Sillanpää M.; van der Wal A.; Biesheuvel P. M.; Porada S.; Dykstra J. E. Exceptional Water Desalination Performance with Anion-Selective Electrodes. Adv. Mater. 2019, 31, 1806937. 10.1002/adma.201806937. [DOI] [PubMed] [Google Scholar]
- Lee J.-H.; Bae W.-S.; Choi J.-H. Electrode reactions and adsorption/desorption performance related to the applied potential in a capacitive deionization process. Desalination 2010, 258, 159–163. 10.1016/j.desal.2010.03.020. [DOI] [Google Scholar]
- He D.; Wong C. E.; Tang W.; Kovalsky P.; Waite T. D. Effect of structural transformation of nanoparticulate zero-valent iron on generation of reactive oxygen species. Environ. Sci. Technol. Lett. 2016, 3, 222–226. 10.1021/acs.est.5b04988. [DOI] [PubMed] [Google Scholar]
- Cheng W.; Liu C.; Tong T.; Epsztein R.; Sun M.; Verduzco R.; Ma J.; Elimelech M. Selective removal of divalent cations by polyelectrolyte multilayer nanofiltration membrane: Role of polyelectrolyte charge, ion size, and ionic strength. J. Membr. Sci. 2018, 559, 98–106. 10.1016/j.memsci.2018.04.052. [DOI] [Google Scholar]
Associated Data
This section collects any data citations, data availability statements, or supplementary materials included in this article.


