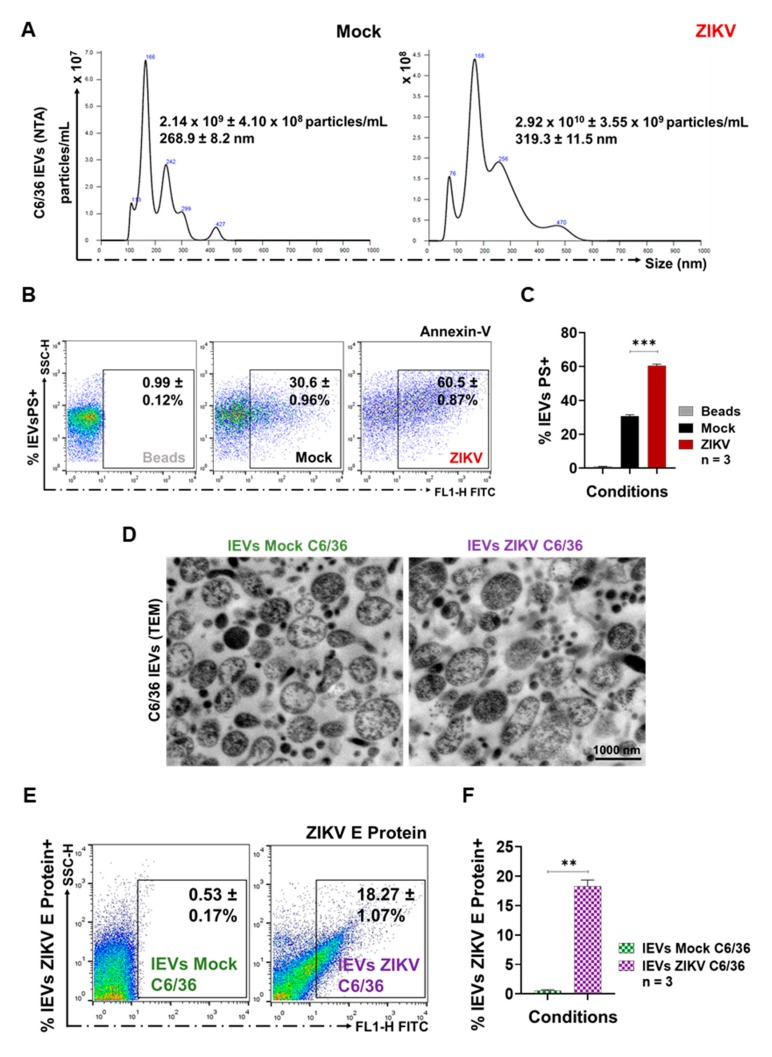
Figure 2.
ZIKV-infected C6/36 cells issue the large extracellular vesicles (lEVs) phosphatidylserine (PS)+. (A) Nanoparticles tracking analysis (NTA) of the purified lEVs isolates from the mock and ZIKV-infected C6/36 cells. Histograms are the representative mean ± SD of the nanoparticle’s concentration (particles/mL) and the size (nm) from three independent experiments. (B) PS detection by the Annexin-V binding assay. The fluorescence emitted by Annexin-V binding is proportional to PS levels. FACS dot plots are the representative mean ± SD of the lEVs PS+ from three independent experiments. (C) lEVs PS+ percentages obtained by FACS. The PS levels were compared (by an unpaired Student’s t-test) with the mock lEVs (*) value. (D) Transmission electron microscopy (TEM) images from the mock C6/36 and the ZIKV-infected C6/36 lEVs (1000 nm scale). (E) ZIKV E protein detection on the lEVs surface by FACS assay. Dot plots are the representative mean ± SD of the lEVs ZIKV E protein+ from three independent experiments. (F) Percentages of the lEVs ZIKV E protein+ by FACS. The ZIKV E protein levels were compared (by an unpaired Student’s t-test) with the mock C6/36 (*) value. Statistical significance was recognized as ** when p < 0.01, and *** when p < 0.0001.

