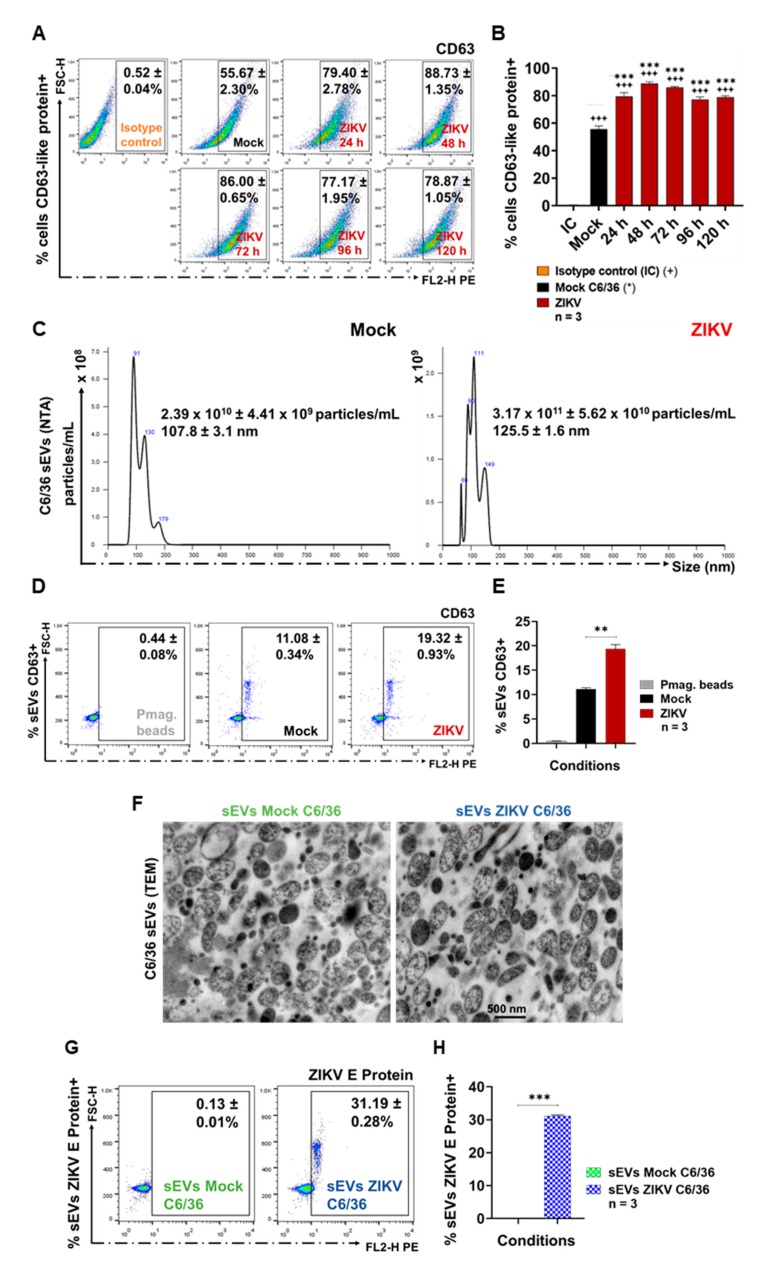
Figure 3.
ZIKV-infected C6/36 cells issue small EVs (sEVs) CD63+. (A) CD63-like detection at 24, 48, 72, 96, and 120 h PI by FACS. Dot plots are the representative mean ± SD of positive cells from three independent experiments. Isotype IgG1 antibody was used as negative control. (B) Cells CD63-like+ percentages obtained by FACS. The levels of CD63-like protein were compared (by an unpaired Student’s t-test) with the isotype control (+) and the mock cells (*) values. (C) NTA of the purified sEVs isolates from the mock and the ZIKV-infected C6/36 cells. Histograms are the representative mean ± SD of the nanoparticle’s concentration (particles/mL) and the size (nm) from three independent experiments. (D) sEVs CD63+ coupled with paramagnetic bead detection by FACS. Dot plots are the representative mean ± SD of the sEVs CD63+ from three independent experiments. (E) sEVs CD63+ percentages obtained by FACS. The CD63 levels were compared (by an unpaired Student’s t-test) with the mock sEVs CD63+ (*) values. (F) Transmission electron microscopy (TEM) images from the mock and the ZIKV-infected C6/36 sEVs (500 nm scale). (G) ZIKV E protein detection on the sEVs coupled with paramagnetic beads by FACS assay. Dot plots are the representative mean ± SD of the positive sEVs ZIKV E protein+ from three independent experiments. (H) Percentages of the sEVs ZIKV E protein+ by FACS. The ZIKV E protein levels were compared (by an unpaired Student’s t-test) with the sEVs mock C6/36 (*) values. Statistical significance was recognized as ++ or ** when p < 0.01, and +++ or *** when p < 0.0001.

