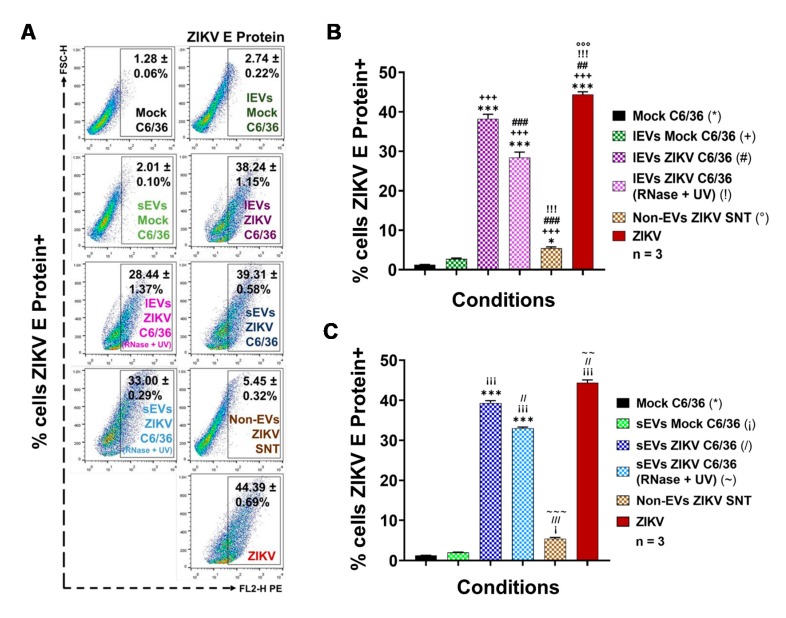
Figure 5.
ZIKV E protein is present on the membrane’s surface of naïve C6/36 cells after the stimulus with ZIKV-infected C6/36 EVs. (A) ZIKV E protein detection at different EV stimuli conditions (FACS assay). Dot plots are the representative mean ± SD of the positive cells from three independent experiments. (B) Percentages of ZIKV E protein+ cells (FACS) after the lEVs stimuli. The levels of the ZIKV E protein were compared (by an unpaired Student’s t-test) between all conditions’ values. Statistical significance was recognized as *, +, #, !, or ° when p < 0.05, **, ++, ##, !!, or °° when p < 0.01, and ***, +++, ###, !!!, or °°° when p < 0.0001. (C) Percentages of ZIKV E protein+ cells (FACS) after the sEVs stimuli. The levels of the ZIKV E protein were compared (by an unpaired Student’s t-test) between all conditions’ values. Statistical significance was recognized as *, ¡,/, or ~ when p < 0.05, **, ¡¡,//, or ~~ when p < 0.01, and ***, ¡¡¡,///, or ~~~ when p < 0.0001.

