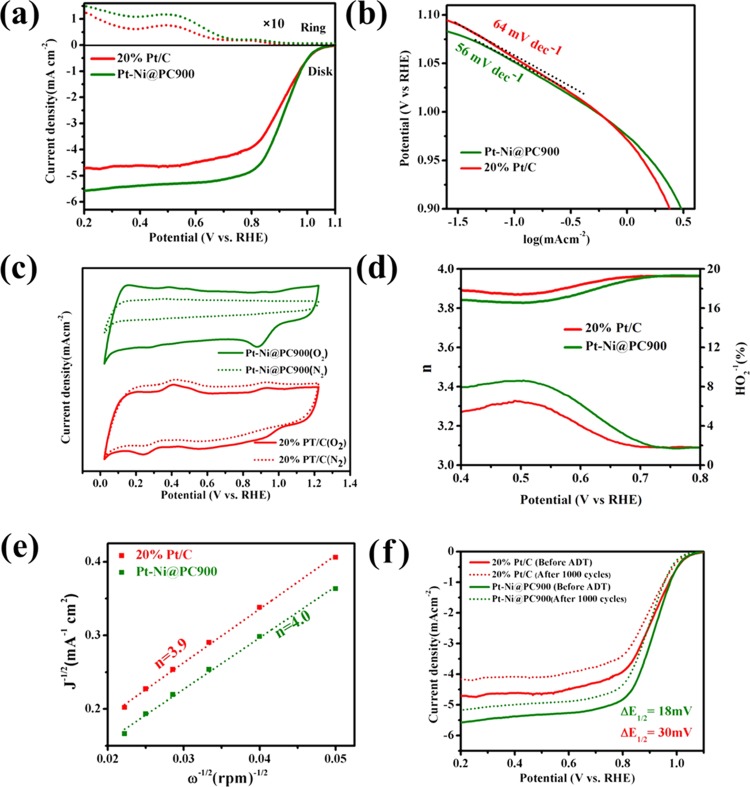
Figure 5.
(a) ORR results for Pt-Ni@PC900 and 20% Pt/C at a rotation rate of 1600 rpm in the basic electrolyte of 0.1 M KOH with oxygen saturation at 5 mV s–1 through a constant potential of 1.5 volt vs RHE applied on the Pt-ring; the disk current is located at the lower side, while the ring current, called the positive current, is present on the upper side (dotted curves). (b) Tafel plots from ORR LSV results (at 1600 rpm) for Pt-Ni@PC900 and 20% Pt/C. (c) CV curves of Pt-Ni@PC900 and 20% Pt/C on the RDE with 50 mV/s scan rate under saturated nitrogen (dotted lines) and O2 (solid lines) in 0.1 M KOH. Pt-Ni@PC900 shows much more positive ORR onset potential and higher cathodic current than 20% Pt/C. (d) Electron number and H2O2 yield results gathered from RRDE data displayed at different potentials vs RHE. (e) K-L plots for Pt-Ni@PC900 and 20% Pt/C at 0.7 V vs RHE. (f) LSV results for Pt-Ni@PC900 and 20% Pt/C before and after ADTs.

