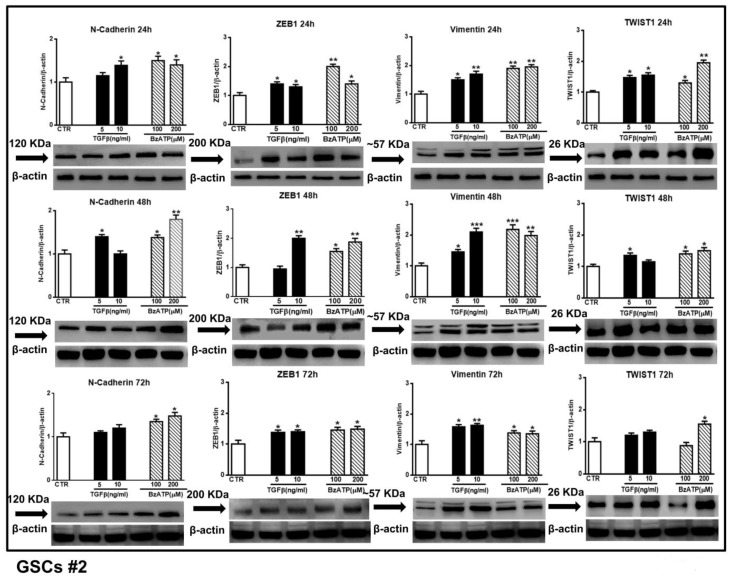
Figure 5.
Effect of TGFβ1 or BzATP on EMT markers evaluated by western blot analysis at different times after drug administration to cultured GSCs #2. After exposure of the cells to different concentrations of TGFβ1 or BzATP, they were harvested at the indicated time periods. The protein levels of selected EMT markers were determined by western blot analysis. Immunoblots were obtained by exposing membranes to appropriate antibodies, recognizing proteins with different molecular weights (indicated close to the immunobands, over the arrows). Immunoblots were then re-probed with an antibody against β actin and quantified by densitometric analysis, the values of which, normalized to β actin used as an internal control, are reported in the histograms, assuming the value of control/β-actin=1. Immunobands reported in the figure are representative of three independent experiments using the same cells. Also in this case, the bands of β-actin are the same for the blots related to the same time point, as they were obtained by cutting the same membrane at different heights corresponding to the molecular weights of the selected markers. *p < 0.05, **p < 0.01, ***p < 0.001: statistical significance vs. untreated GSCs assumed as control (CTR) (one-way ANOVA plus Dunnett’s test).

