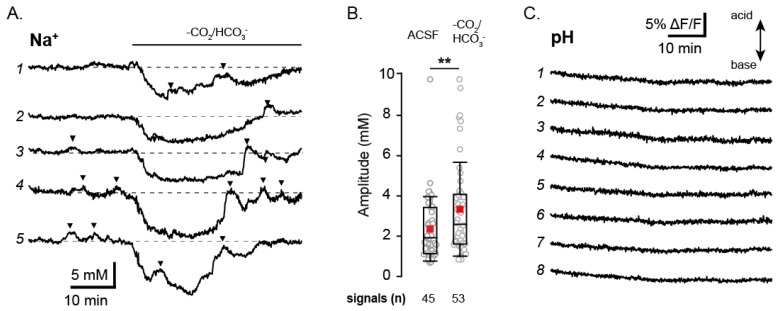
Figure 6.
The influence of pH on astrocytic Na+ fluctuations. (A) Shows five example astrocytes traces from a single SBFI experiment wherein HEPES buffered ACSF was washed in after 20 min of baseline measurement. Analyzed fluctuations are identified by black arrows. (B) Box plots comparing control condition fluctuation amplitudes to those measured in the HEPES buffered ACSF. (C) BCECF fluorescence traces from 8 individual astrocytes in a single experiment. ** 0.001 ≤ p < 0.01.

