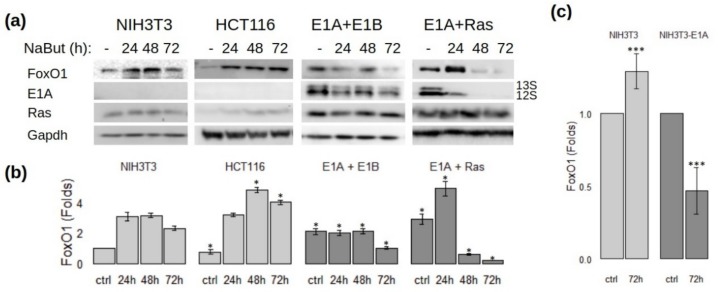
Figure 2.
Sodium butyrate (NaBut) differently modulates FoxO1 expression in E1A-negative and E1A-positive cells. (a) NIH3T3, E1A + E1B, and E1A + Ras rodent cells and HCT116 human cells were treated with 4 mM NaBut for 24–72 h. Cell extracts were analyzed by immunoblotting. (b) The plots representing the load-control-weighted FoxO1 expression (fold change). Expression level was normalized against the expression level of the particular protein in the control sample of NIH3T3 cells which was set at 1. Single asterisk represents significant difference from the corresponding time point in NIH3T3 cells (p < 0.05). (c) The plots representing the FoxO1 expression in E1A-negative and E1A-expressing NIH3T3 cells (NIH3T3 stable transfected with pE1A vector coding the early region of Ad 5 (E1Aad5)) under prolonged NaBut treatment. Results are presented as fold changes in relation to the corresponding control sample. Triple asterisks represent significant difference between 72h points (p < 0.01).

