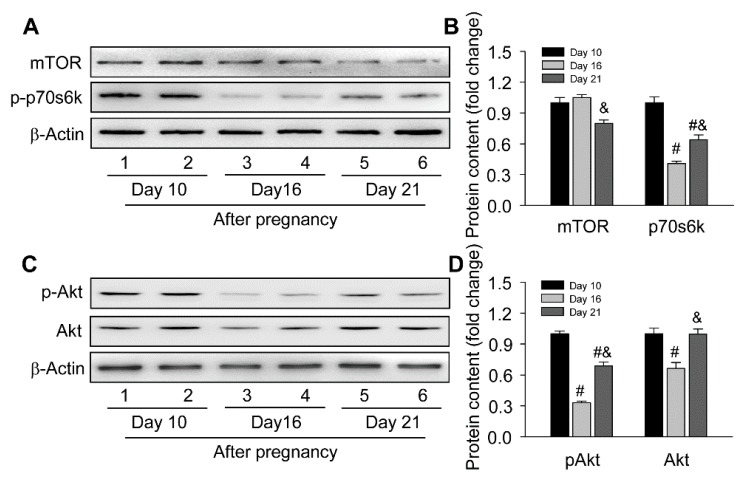
Figure 3.
Expressions changes of Akt/mTOR signaling during the luteal development in ovaries of pregnant rats: (A) representative western blotting analyses depicting the protein levels of mTOR and p-p70s6k; (B) summarized intensities of mTOR and p-p70s6k blots normalized to the control; (C) representative western blotting analyses depicting the protein levels of p-Akt and Akt; (D) summarized intensities of p-Akt and Akt blots normalized to the control. Each value represents the mean ± SE, n = 6. ANOVA was used to analyze the data. #: p < 0.05 vs. p on day 10, &: p < 0.05 vs. p on day 16.

