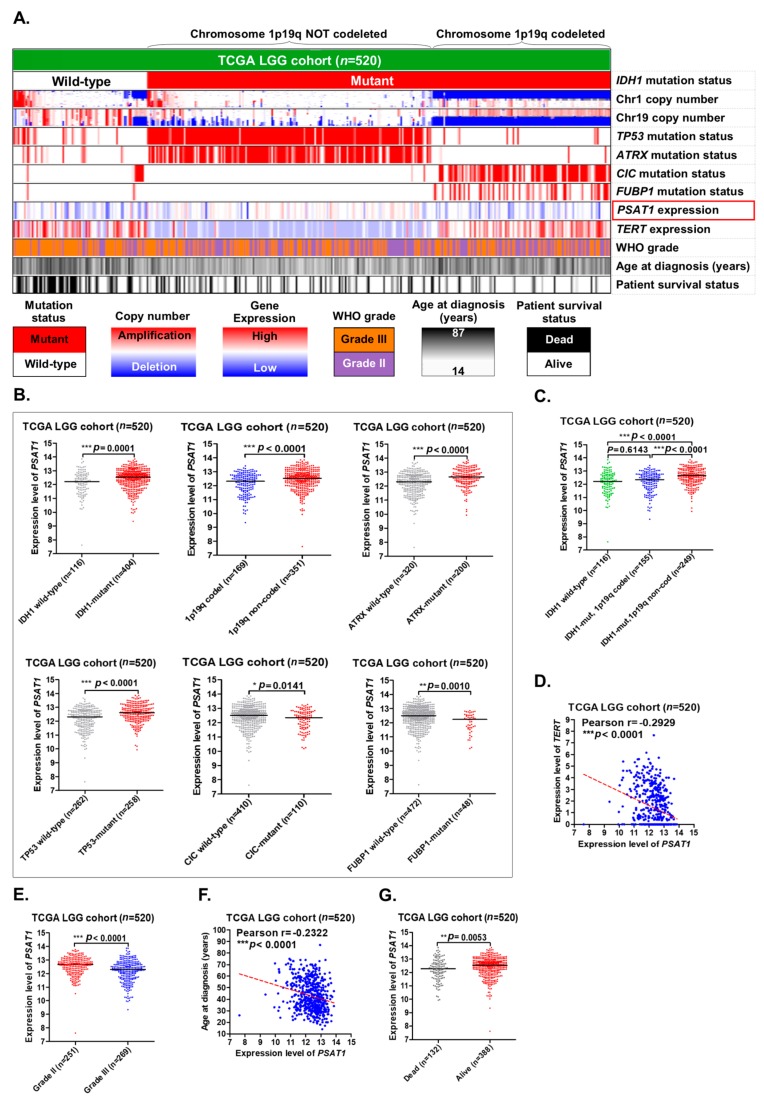
Figure 2.
The correlations between PSAT1 expression and other clinico-molecular parameters in LGGs in The Cancer Genome Atlas (TCGA) dataset. (A) A gene expression heatmap was constructed to show the correlations of PSAT1 expression with other parameters in LGGs. LGG patients in the TCGA dataset (n = 520) were classified into three subgroups according to the 2016 World Health Organization (WHO) classification of central nervous system (CNS) tumors (IDH1 wild-type, IDH1 mutations with chromosome 1p19q codeletion, and IDH1 mutations without chromosome 1p19q codeletion). (B) The correlations of PSAT1 expression with IDH1 mutations, chromosome 1p19q codeletion, ATRX mutations, TP53 mutations, CIC mutations, and FUBP1 mutations. (C) The expression levels of PSAT1 in the three subgroups of LGGs classified according to the 2016 WHO classification of CNS tumors. (D) The correlation between PSAT1 expression and TERT expression. (E) The expression levels of PSAT1 in grade II and III gliomas. (F) The correlation between PSAT1 expression and patient age. (G) The expression levels of PSAT1 in dead and alive LGG patients. The symbols *, ** and *** denote p < 0.05, p < 0.01 and p < 0.001, respectively.

