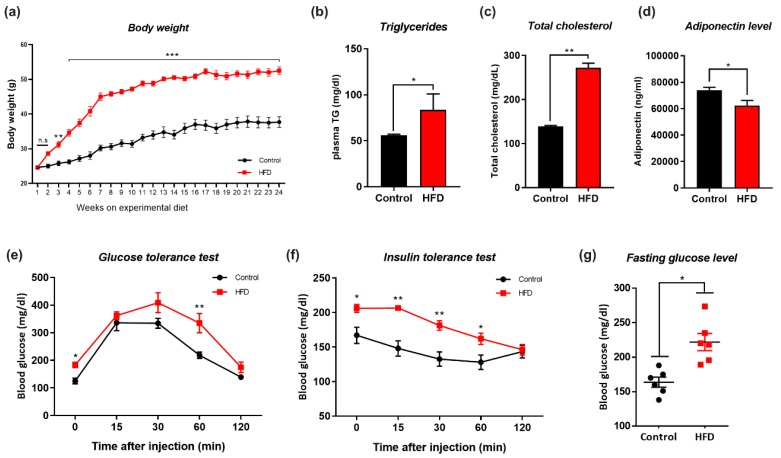
Figure 1.
Effects of high fat diet (HFD) on metabolic parameters. Changes in (a) Body weight, (b) Plasma triglyceride levels, (c) Plasma total cholesterol level, (d) Plasma adiponectin level, (e) Glucose tolerance test, (GTT), (f) Insulin tolerance test, (ITT), (g) Fasting glucose between normal chow diet (NCD) and HFD fed experimental mice groups. (n = 12 mice/group). Data are presented as mean ± SEM and were analyzed using one-way ANOVAs between NCD and HFD mice groups. Significance = * p < 0.05, ** p < 0.01, *** p < 0.001.

